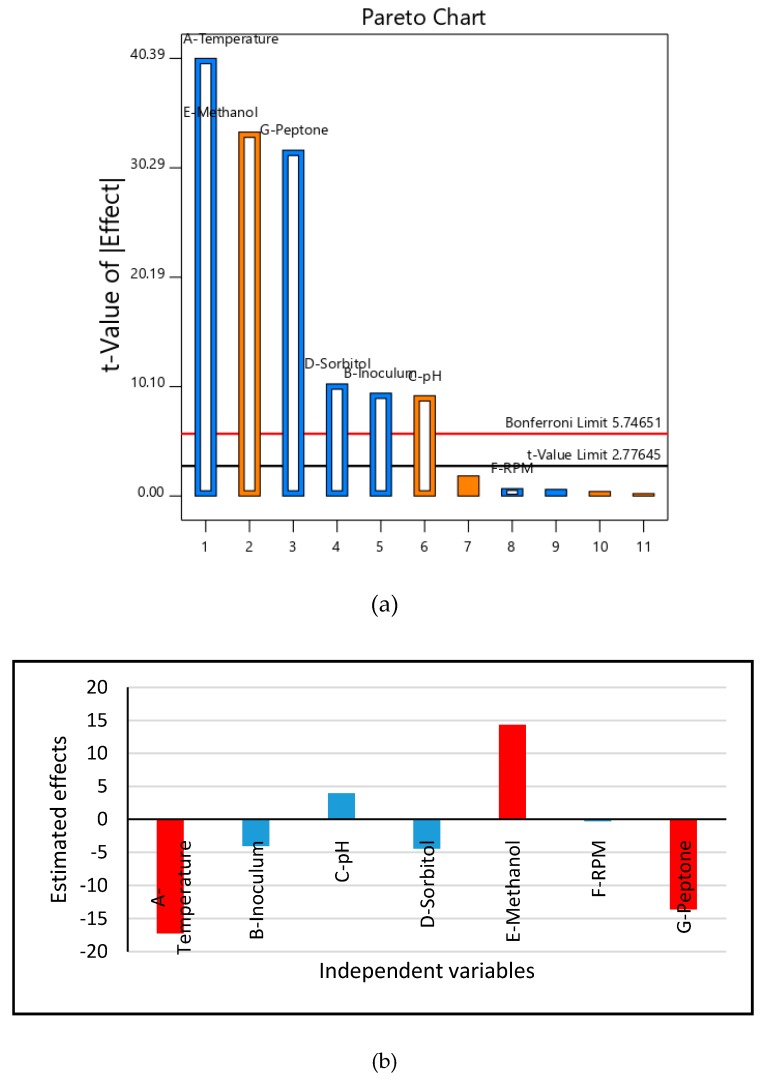
Figure 3.
(a) Pareto chart obtained from the Plackett-Burman design representing the order and % contribution of each parameter on production of stable HSA. Blue and orange color represent the negative and positive contribution respectively. (b) Estimated effects of independent variables on HSA production by Clone # 14. Red indicate the most significant while blue indicate nonsignificant parameters.

