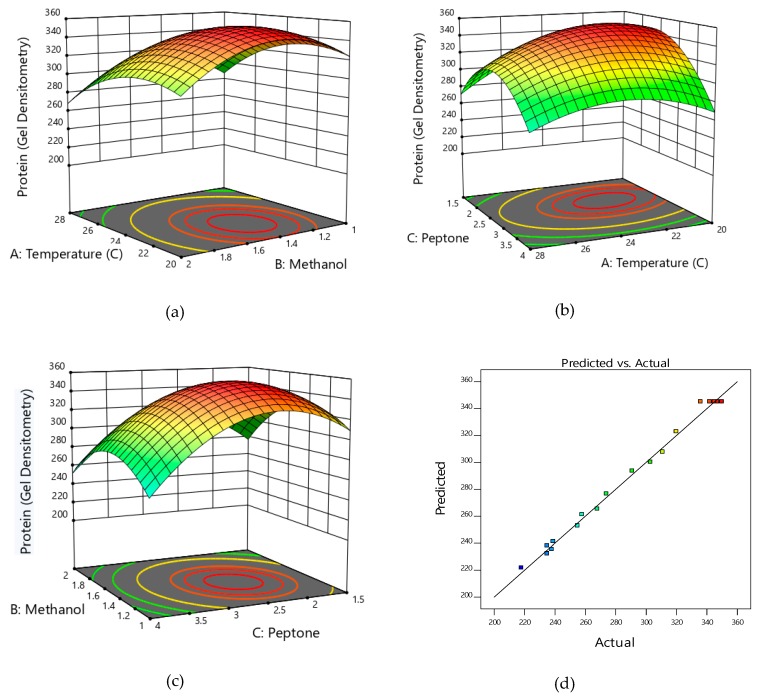
Figure 4.
Three-dimensional response surface graphs and contour plots indicating the effect of individual parameters and the interaction between two parameters. Effect of combined effect of temperature and methanol (a), peptone and temperature (b), and methanol and peptone on HSA production (c). Correlation between the predicted and the observed response (Y as HSA produced in mg/L) (d).

