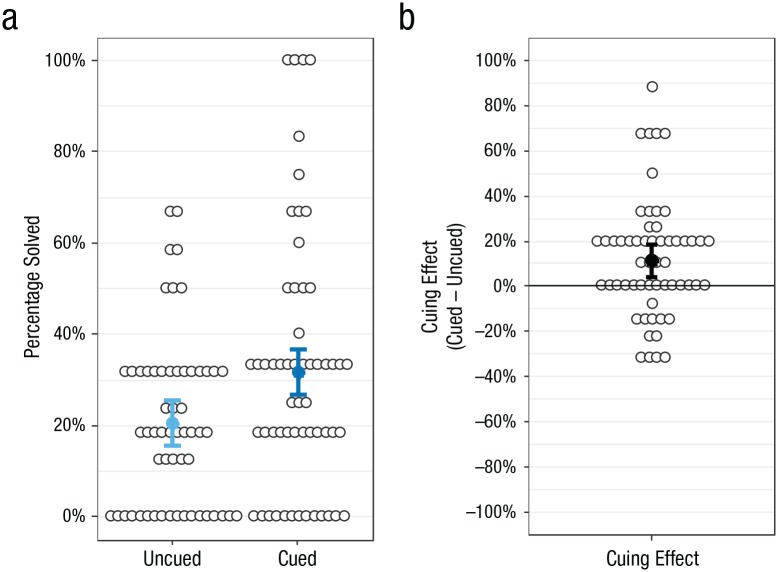
Fig. 2.
Solving rate in the morning sessions for uncued and cued puzzles (a) and cuing effect (b; the percentage of cued puzzles solved – the percentage of uncued puzzles solved). Open circles are individual data points, and filled circles are group averages. Error bars represent (a) 95% within-subjects confidence intervals and (b) standard 95% confidence intervals.

