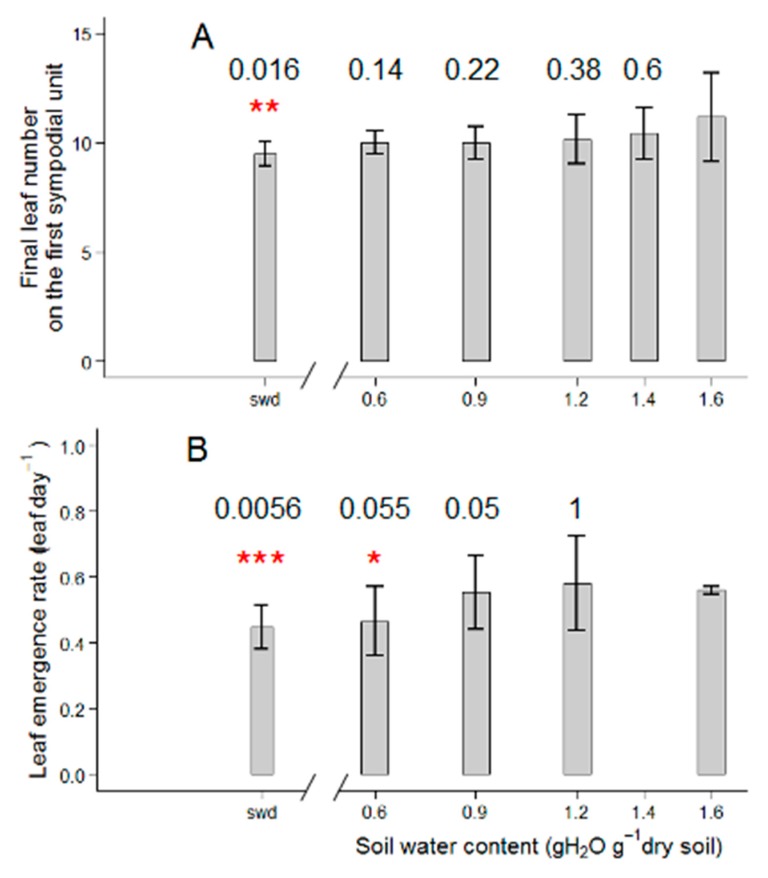
Figure 2.
Soil water content response of leaf production-related traits: Final leaf number (A) and leaf emergence rate (B) in Wva106 plants grown at five different but stable soil water contents: 0.6, 0.9, 1.2, 1.4, and 1.6 g H2O g−1 dry soil and a severe swd. Means and standard errors are presented by bar charts and vertical lines, respectively (3 < n < 7). Leaf emergence rate could not be calculated for the 1.4 g H2O g−1 dry soil because of typing errors during notations of phenological stages. Significant differences between mean trait values for plants grown at 1.6 g H2O g−1 dry soil versus other soil water contents are shown by stars above bars according to Wilcoxon-Mann-Whitney statistical test (p-value ≤ 0.01 = ***, 0.01 < p-value ≤ 0.05 = **, 0.05 < p-value ≤ 0.1 = *, p-value > 0.1 = null hypothesis cannot be rejected), p-values are given above the bars.

