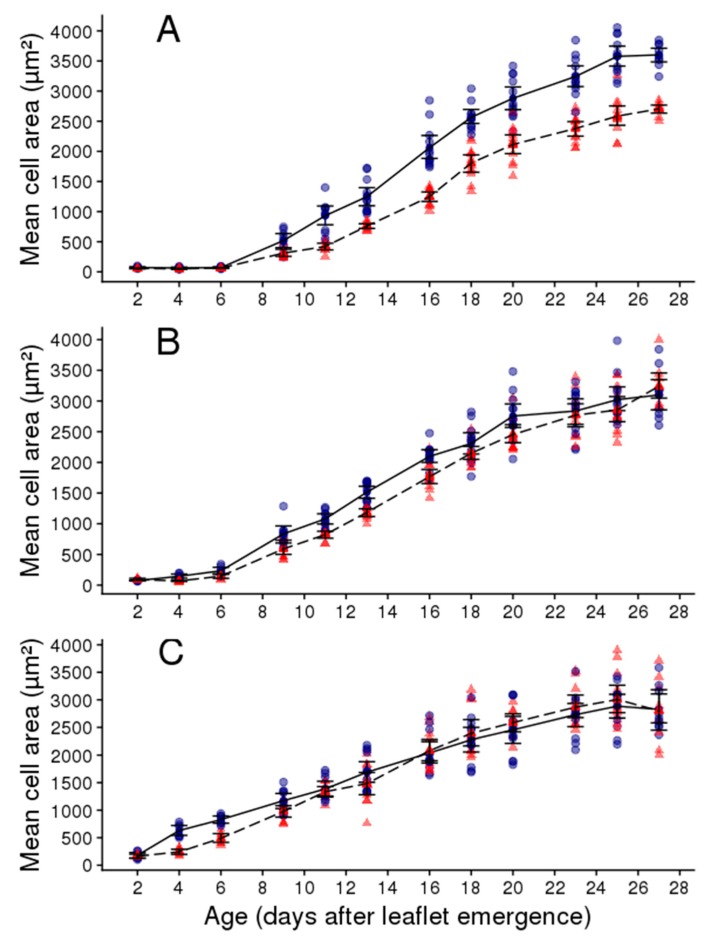
Figure 5.
Dynamics of adaxial epidermal cell area in leaflets two and three of the second leaf of the second sympodial unit in Wva106 plants grown in WW and WD treatments, blue circles with full lines and red triangles with dashed lines, respectively. In each leaflet, cell areas were measured in three zones: At the base (A), in the middle (B), and at the tip (C). Each point represents mean epidermal cell area within a given zone of the leaflet (n = 75). The full and dashed lines link mean cell area. Vertical bars are standard errors around the mean value at each leaflet age.

