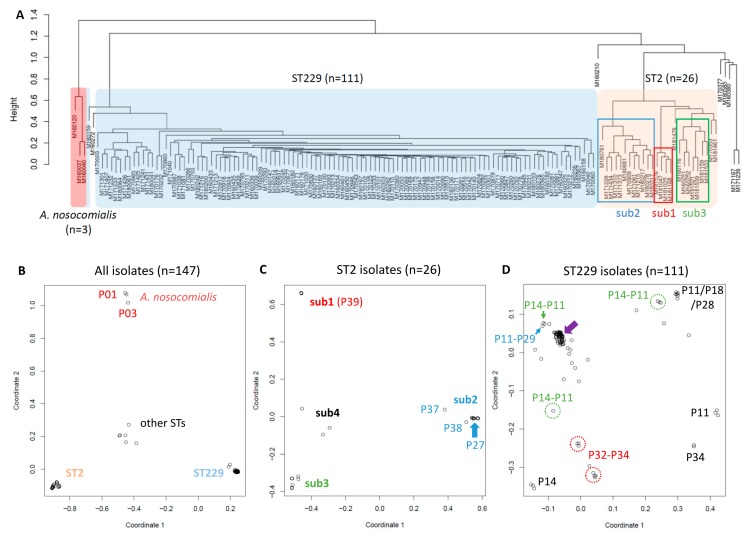
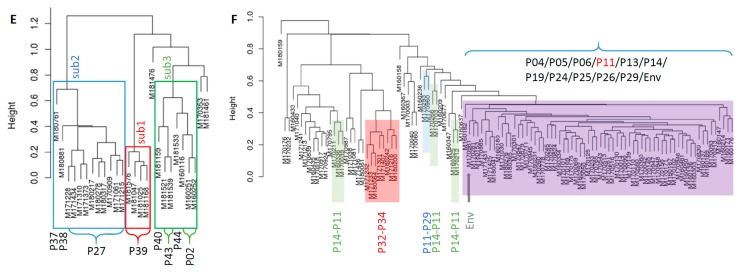
Figure 4.
K-mer-based kWIP (k-mer weighted inner product) analysis of 147 Acinetobacter clinical isolates. (A) Phylogeny tree from hierarchical clustering using the complete linkage method. (B–D) Plots of metric multidimensional scaling (MDS). B: all 147 isolates; C: 26 ST2 isolates; and D: 111 ST229 isolates. Four main sub-clusters are identified in ST2 isolates: sub1, sub2, sub3 and sub4. Filled arrow in D shows a major sub-cluster of ST229 isolates with close relatedness. Dash-circled or arrowed are sub-clusters shared between patients as annotated aside. (E,F) Phylogeny trees of ST2 and ST229 isolates from hierarchical clustering using the complete linkage method. Three main sub-clusters are annotated as sub1, sub2 and sub3 of ST2 in E, with patients’ identities at bottom; the remaining three isolates belong to sub4. Shadowed boxes in F indicate shared sub-MLST types between patients as annotated at bottom. Isolates of the major sub-cluster in D belong to multiple patients as noted in F. The environmental isolate (Env) is arrowed grey.


