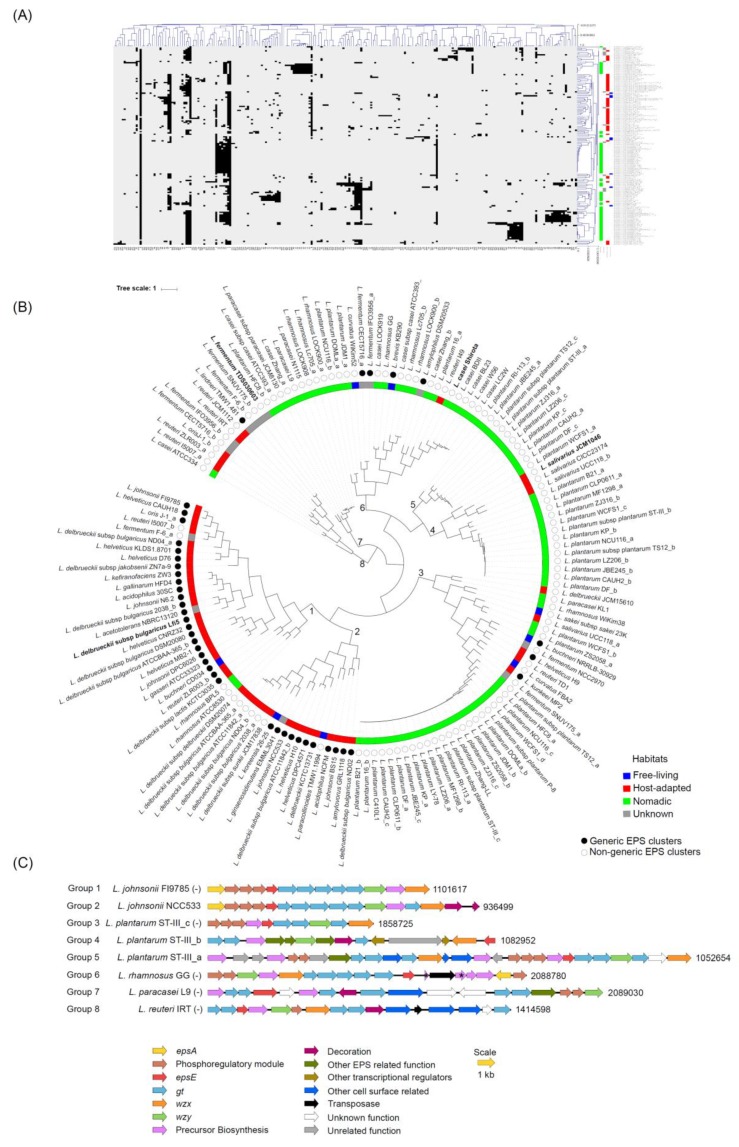
Figure 2.
HCL analysis based on the presence and absence of the protein families across the EPS gene clusters identified in the Lactobacillus genomes indicating (A) a heat map wherein black and white areas represent presence and absence, respectively, of the protein families, (B) grouping of the EPS cluster based on the HCL analysis and (C) representative EPS clusters from each of the eight groups identified in (B). Alphabets after the strain names denote multiple clusters found in some strains. Pseudogenes and the genes which encode for the truncated proteins and hence are likely to be non-functional are indicated by asterisks. Description for numbers at the ends of the clusters and of negative signs in parentheses is given in the legend of Figure 1.

