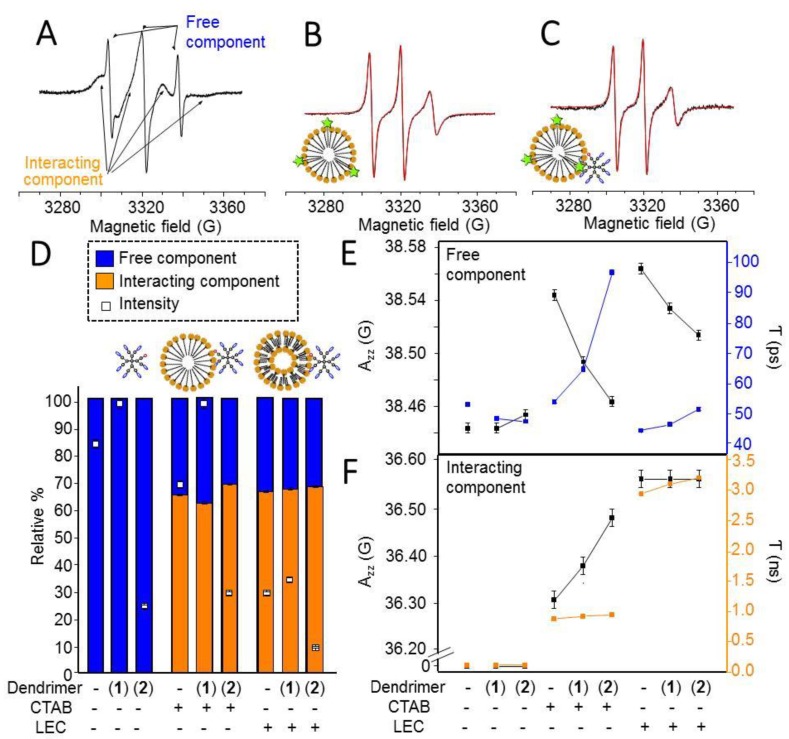
Figure 4.
Experimental spectra and computation spectra/parameters for the CAT12 EPR spectra of the unlabeled heterofunctional dendrimers Gn-PyN in the absence and presence of the model membranes (CTAB micelles and LEC liposomes). (A) EPR spectrum of CAT12 for G1-PyN (1) in the presence of LEC; (B, C) experimental (black) and computed (red) spectra of the interacting component for CAT12 in CTAB sample, alone and in the presence of G2-PyN (2); (D) Relative percentage of Interacting component (bars), and total intensity (squares) as a percentage, where 100% intensity was ascribed to the spectrum at the highest intensity; (E, F) Azz values (left axis) and τ values (right axis) for the Free and the Interacting components. PBS sample was evaluated in the absence of dendrimers and model membranes.

