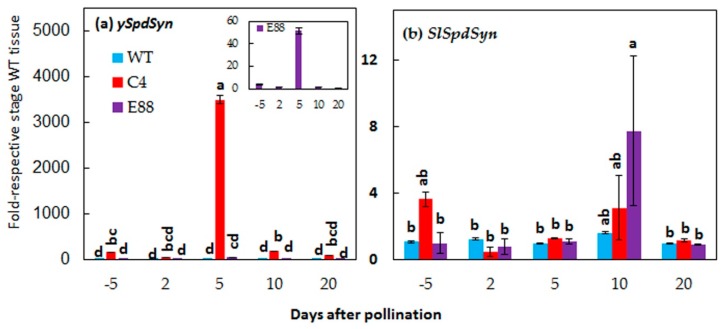
Figure 3.
Changes in steady state levels of (a) ySpdSyn and (b) SlSpdSyn transcripts during early development of WT and ySpdSyn expressing tomato fruits. Total RNA from three biological replicates of floral buds at 5 days before pollination, and flower ovaries at 2, 5, 10, and 20 days after pollination were independently extracted and reverse transcribed. The levels of ySpdSyn and SlSpdSyn transcripts were determined using qRT-PCR with gene-specific primers (Table S3). The inset in upper panel shows the transcript levels of E8:ySpdSyn transgene in E8-8 tissues at a higher magnification. The relative expression levels were calculated by the 2−ΔΔCт method using SlACTIN (Solyc04g011500.2.1) as housekeeping gene and plotted as fold-respective to WT tissues. Shown are average ± standard error. Statistical analyses were performed using the XLSTAT ANOVA method using −5 DAP WT as reference.

