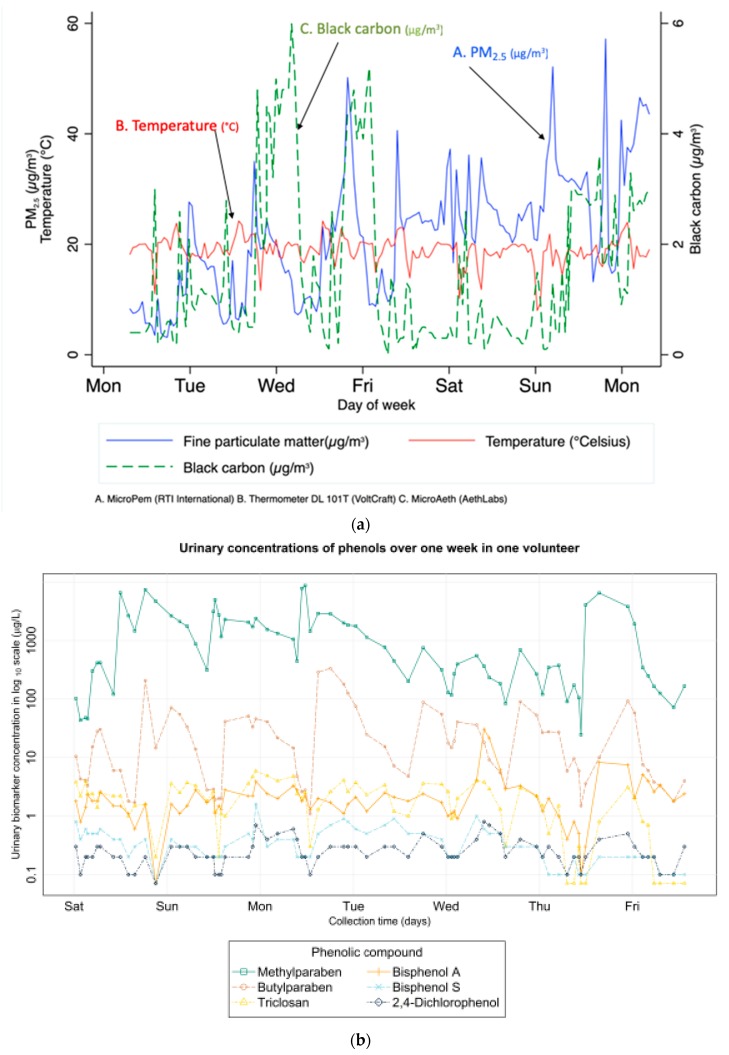
Figure 3.
(a) Temporal variations of personal exposures in one follow-up week in one pregnant woman from SEPAGES cohort. (A) PM2.5 concentration, µg/m3; (B) temperature, °C; (C) Black carbon concentration, µg/m3. (b) Variation of urinary concentrations of phenols in urine samples collected during one week (one pregnant woman from SEPAGES-feasibility cohort; see Vernet et al. [61]).

