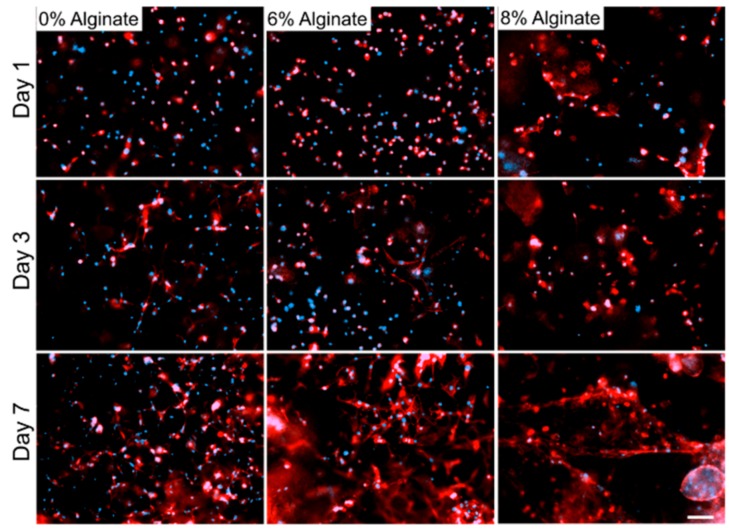
Figure 5.
DAPI and F-actin staining of C2C12 in GelMA hydrogel with alginate concentrations 6% and 8% (w/v) crosslinked with UV and CaCl2. Images were taken on days 1, 3, and 7. Blue color represents the cell nucleus and red color represents the cell cytoskeletal by the F-actin microfilaments. Scale bar denotes 200 µm.

