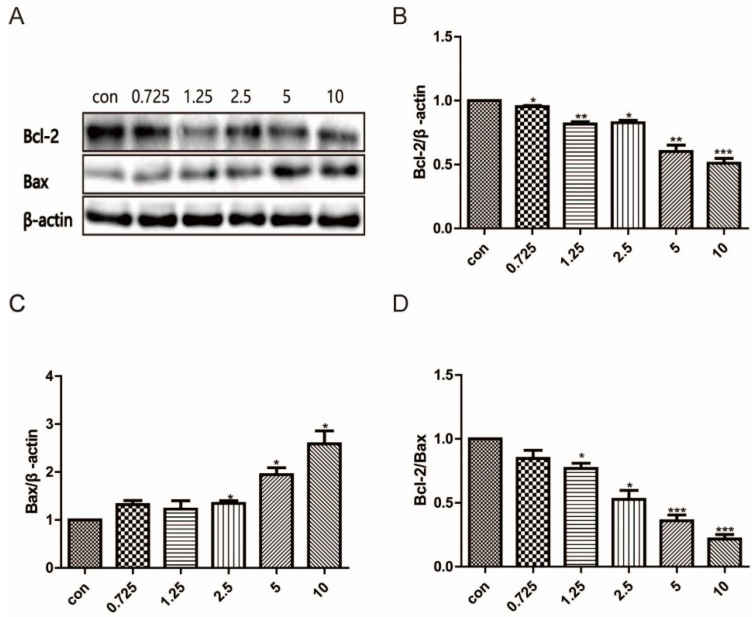
Figure 4.
A549 cells were treated with compound 15 (0, 0.725, 1.25, 2.5, 5, 10 μM) for 72 h. Protein expression levels of Bcl-2 and Bax were measured using western blot analysis. (A) Protein expression levels of Bcl-2 and Bax were measured using western blot analysis. Representative western blot images are shown. (B) Grayscale value analysis of Bcl-2, (C) Bax and (D) Bcl-2/Bax ratio. Data are expressed as means standard deviation from three independent experiments. * p < 0.05, ** p < 0.01 compared with the control group.

