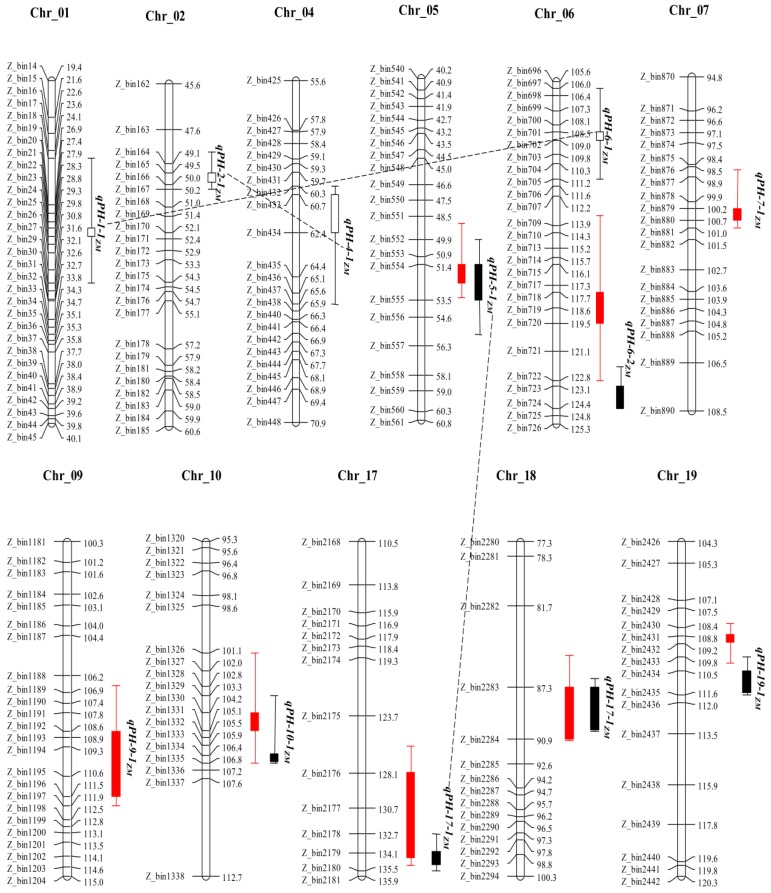
Figure 3.
Distribution of QTLs on genetic map for plant height in the ZM population (here only the genetic map around QTLs is shown). Red graphics represent the QTLs were detected by CIM method. Black graphics represent the QTLs were detected by MCIM method, and the filled graphics represent QTLs with additive effect, while the hollow graphics represent QTLs with non-additive effect. Black dotted lines represent that there are epistatic interaction effects between two connected QTLs.

