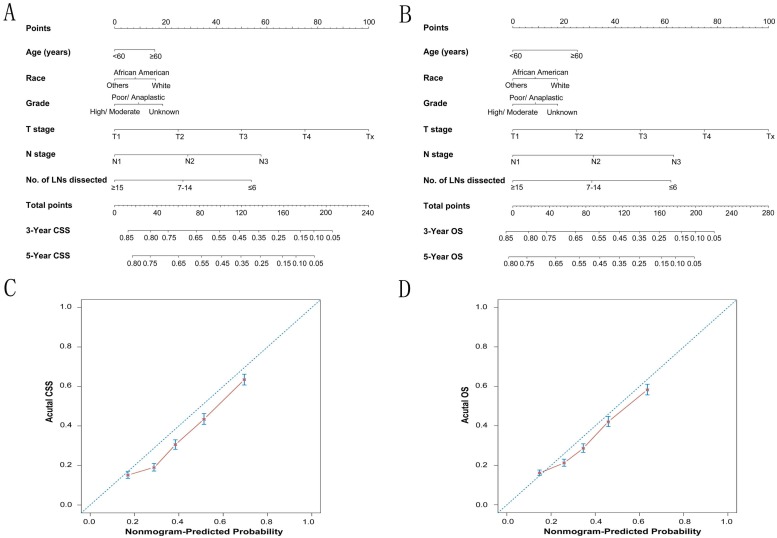
Figure 3.
The calibration plots for predicting CSS and OS of gastric cancer patients. Nomograms can be interpreted by summing up the points assigned to each variable, which is indicated at the top of scale. The total points can be converted to predicted 3-year and 5-year probability of survival for a patient in the lowest scale (A, B). The Harrell's c-indexes for CSS and OS prediction were 0.663 (95% CI: 0.655-0.671) and 0.654 (95% CI: 0.646-0.662) (P< 0.001), respectively. Calibration curves for 5-year CSS (C) and 5-year OS (D) using nomograms with clinicopathological characteristics and LN counts are shown. The x-axis is nomogram-predicted probability of survival and y-axis is actual survival. The reference line is 45°and indicates perfect calibration.

