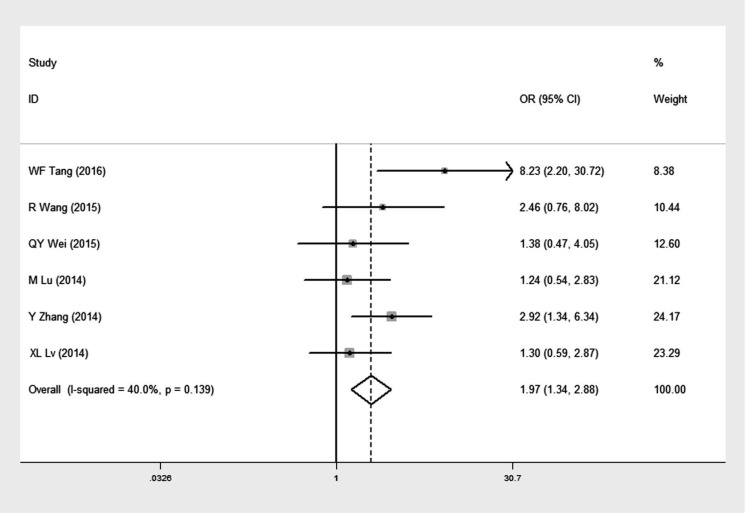
Figure 4.
Forest plot of odds ratio (OR) with 95% CI for the association between high GOLPH3 expression and tumor differentiation in NSCLC, moderate to poor differentiation vs well differentiation. If OR > 1 and the 95% CI doesn't include 1, it indicates that there is an association between high GOLPH3 expression and poor differentiation of tumor.

