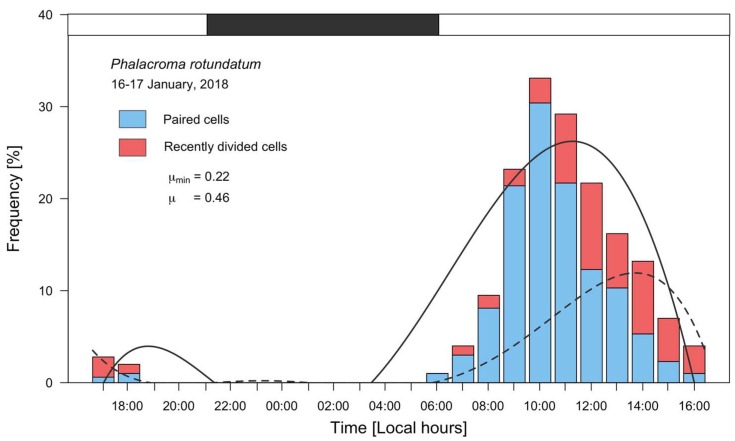
Figure 5.
Distribution of frequencies of vegetative paired (blue bars) and recently divided cells (red bars) of P. rotundatum from 16 to 17 January 2018, fitted to a 5th degree polynomial curve. The solid line curve corresponds to paired cells, and the dashed line to recently divided cells; the black segment in top bar indicates the dark (sunset to sunrise) period.

