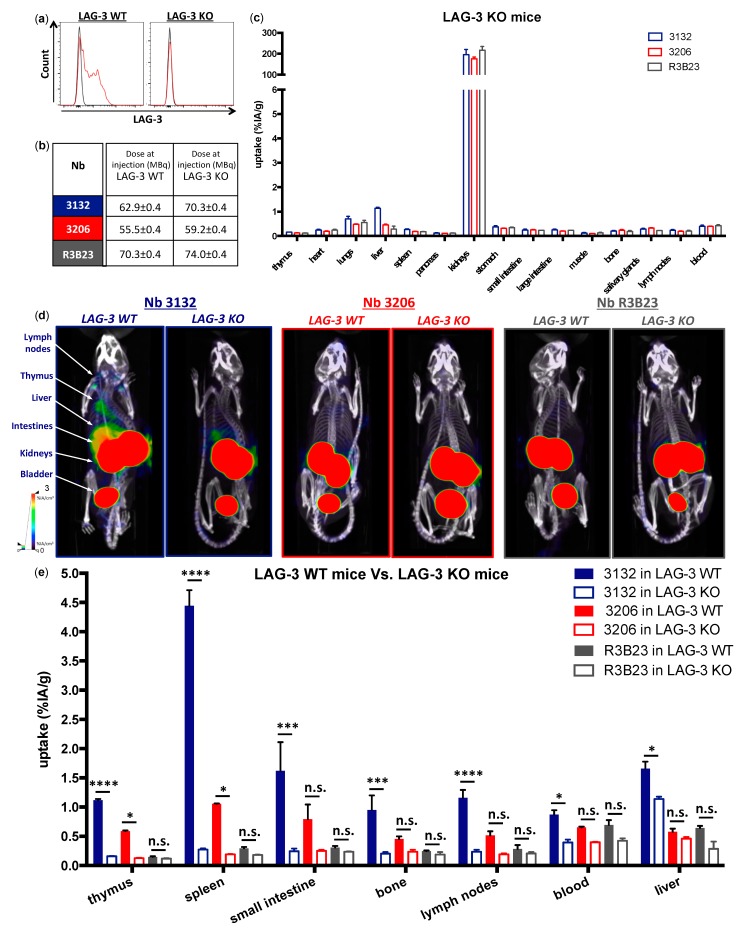
Figure 5.
Characterization and in vivo SPECT/CT imaging with anti-moLAG-3 Nbs in LAG-3 knock-out (KO) mice. (a) Flow cytometry analysis of moLAG-3 expression on stimulated lymphocytes from LAG-3 WT and LAG-3 KO mice. The flow cytometry graphs are representative for three independent mice (n = 1). (b) Dose of in vivo injected 99mTc-Nb conjugates in LAG-3 WT or LAG-3 KO mice. (c) Ex vivo γ-counting of isolated organs from LAG-3 KO mice 80 min after injection of 99mTc-labeled Nbs targeting moLAG-3 or control Nb R3B23. The graph summarizes the data obtained in three mice as mean ± SD of %IA/g (n = 1). (d) Representative SPECT/CT scans of LAG-3 WT mice (left) and LAG-3 KO mice (right) 60 min after injection of 99mTc-labeled Nb 3132, 3206, or control Nb R3B23. (e) Ex vivo γ-counting of isolated organs from LAG-3 WT mice and LAG-3 KO mice 1 h after injection of 99mTc-labeled Nbs targeting moLAG-3 or control Nb R3B23. The graph summarizes the data obtained in three mice as mean ± SD of %IA/g (n = 1).

