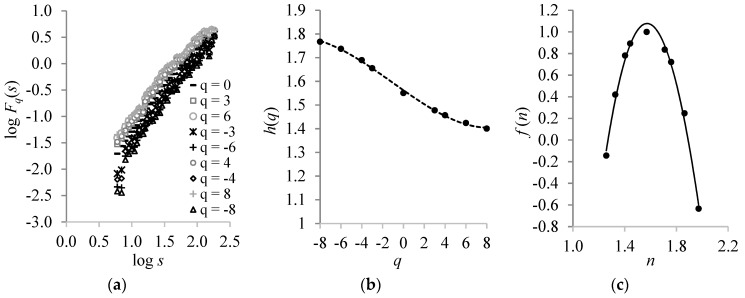
Figure 3.
(a) The multifractal detrended fluctuation analysis (MF-DFA) fluctuation factor Fq(s) of the CST time-series as a function of the time scale s of particular moments q. (b) The variability of the generalized Hurst exponent h(q) with respect to q-values. The best fit was achieved by the polynomial h(q) = 1·10−4q3 + 0.0004q2 − 0.03q + 1.56, with R² = 1.00. (c) The variability of the singularity spectrum f(n) versus singularity strength n, with a best fit expressed by the equation: f(n) = 1.74n3 − 19.48n2 + 48.35n − 33.57, with R² = 0.99.

