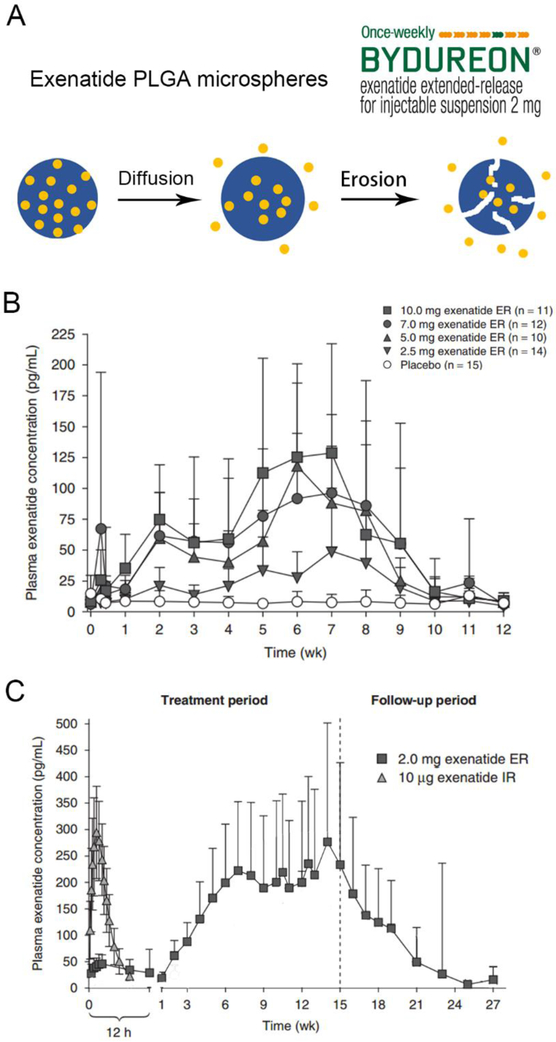
Figure 5.
(A) Release process of exenatide from microspheres. (B) Mean concentration-time profile of exenatide following single dose of Bydureon®. (C) Mean concentration-time profile of exenatide following repeated weekly administrations of Bydureon® (exenatide ER same as exenatide QW) compared with a single administration of Byetta® (exenatide IR). Adapted with permission of © 2011 Adis Data Information BV from Fineman et al. Clin Pharmacokinet 2011; 50 (1).[97]

