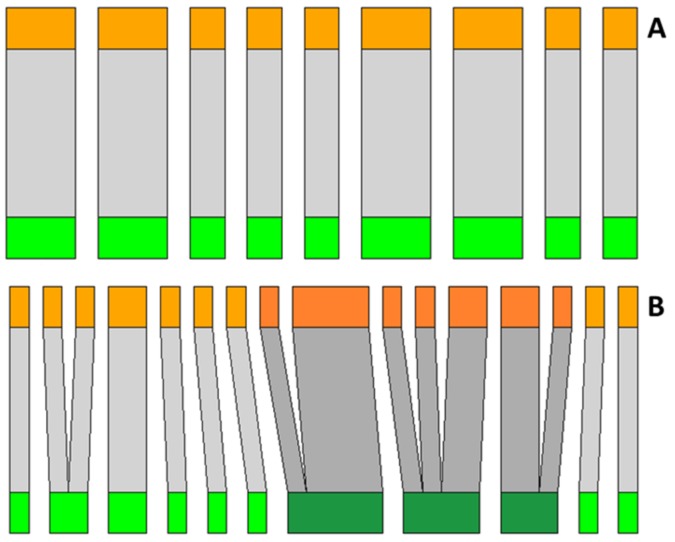
Figure 6.
Examples of plant–galling insect networks sampled in the study. For each network, green bars represent host plant species and orange bars represent galling insect species. Gray bar thickness is proportional to the number of interactions of each species (drawn at different scales). (A) Structure of a network without the presence of superhost species (area 13; Table 2). (B) Structure of a network with presence of three species of superhost plants (area 5; Table 2). Species of Qualea and their galling insects are represented by dark green and orange bars, respectively.

