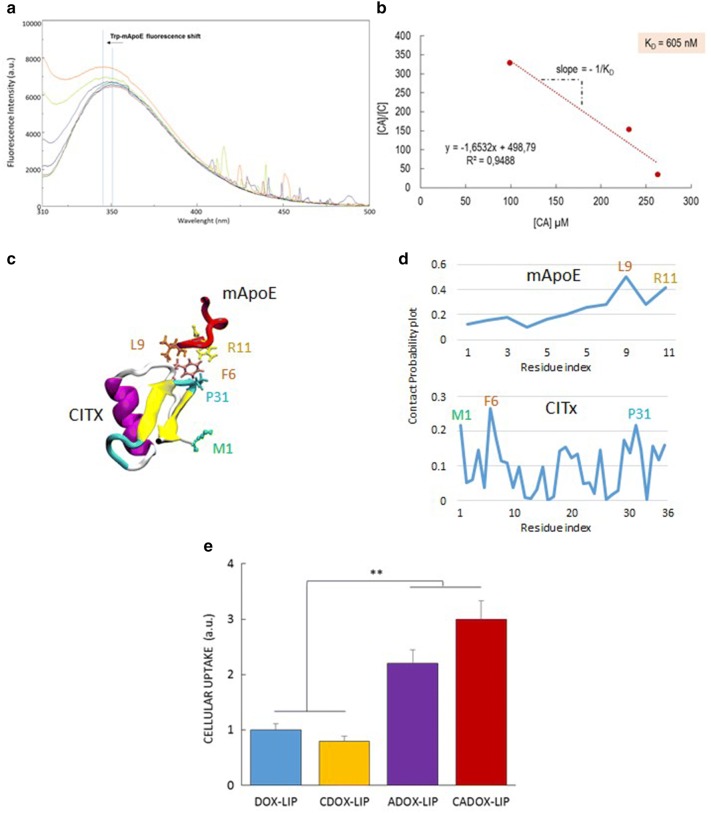
Fig. 4.
a Trp fluorescence of 30 μM mApoE after incubation with different doses of ClTx ranging from 0 to 30 μM. b Scatchard plot to determine the binding constant between mApoE e ClTx in solution, where [CA] is the concentration of ClTx-mApoE complex and [C] is concentration of ClTx. c Visual Inspection of mApoE-CITX interaction by MDS. Residues mainly responsible for the protein–protein interaction are also highlighted. d Contact probability plot reporting the probability of each protein residue to be part of the protein–protein contact surface. e Cellular uptake of DOX in different LIP formulations. Data are expressed as a mean ± SD of triplicates

