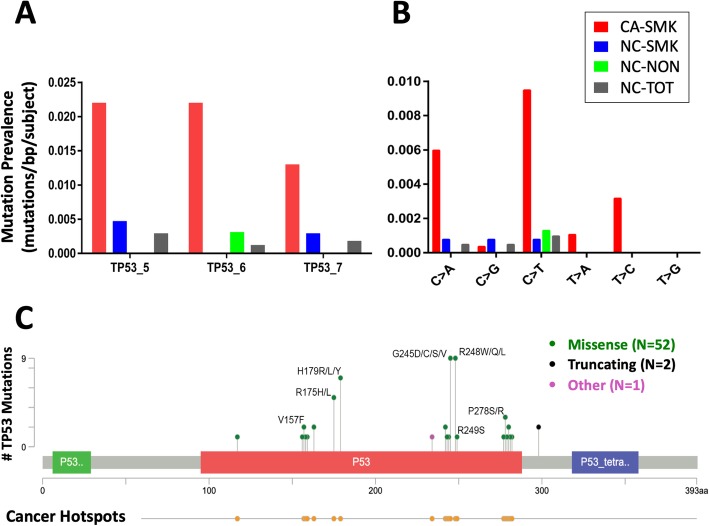
Fig. 2.
Inter-cohort comparison of TP53 mutation mean prevalence. a Mean mutation prevalence among subjects within each cohort in each separate TP53 exon 5, 6, or 7 (mutations/target base/subject). b Cohort- and substitution-specific mean mutation prevalence for the combined three TP53 exon targets. c Number of mutations at TP53 hotspot sites. Inset: number of mutations according to mutation type. Mutations were defined as those with VAF (variant allele reads/total allele reads) > 0.05% and significantly above IS background VAF based on contingency table analysis (see Methods). TP53 mutations in CA-SMK subjects were enriched significantly at “hotspot” lung cancer driver mutation sites (p = 0.002)

