Fig. 5.
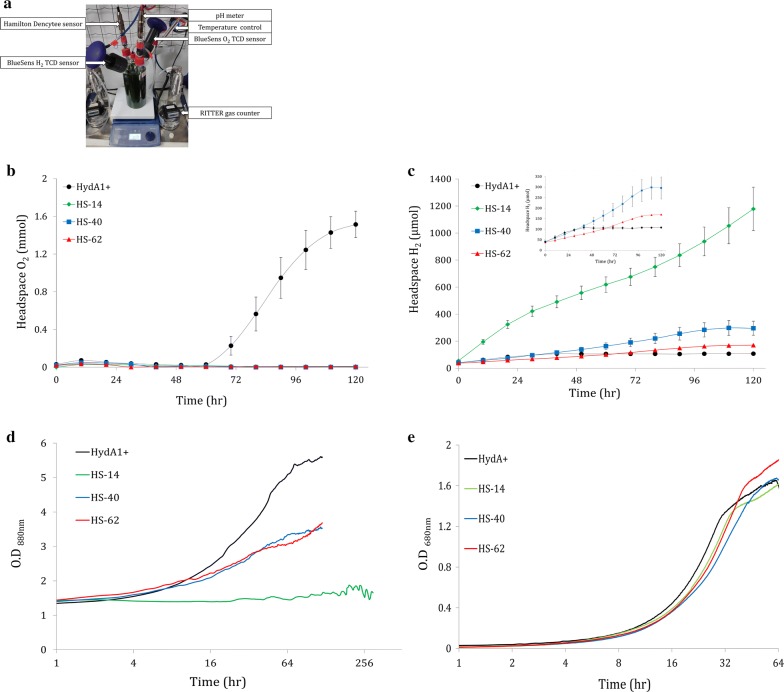
Long-term H2 photoproduction in 1-L BlueSens photobioreactors. a Picture of the BlueSens 1-L photobioreactor measuring system. The bioreactors were continuously illuminated at 180 µmol photons m−2 s−1. Cultures of HydA1+ (n = 8) and 3 HS clones: HS-14 (n = 5), HS-40 (n = 3) and HS-62 (n = 3) (black, green, blue and red, respectively) were measured. TCD sensors (BlueSens) were used to monitor. b O2 accumulation and c H2 accumulation in the bioreactor headspace. Error bars are in SE. The inset in (c) is a zoomed window of the blue, red and black traces. d Corresponding cell density of the different clones under the bioreactors anoxic mixotrophic conditions, measured in A880nm by Hamilton Dencytee sensor. e Cell density of the different clones under aerobic mixotrophic conditions, measured in A680nm. Cultivation was performed in Multi-Cultivator MC 1000-OD under constant illumination of 180 µmol photons m−2 s−1 (n = 4)

