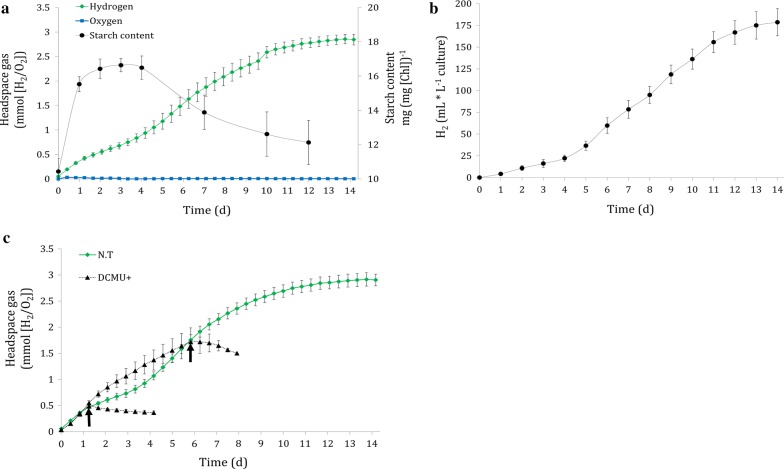
Fig. 6.
Phenotype of clone HS-14. a HS-14 starch accumulation during H2 production period. The bioreactors were continually illuminated at 180 µmol photons m−2 s−1. 2 mL samples were drawn for starch determination (black) while TCD sensors monitored H2 and O2 evolution (green and blue, respectively). b Gas output during starch analysis. Gas flow was measured using Ritter’s milligascounter attached to the culture headspace. Error bars are in SE (n = 4). c Addition of DCMU to HS-14 during H2 production phases. The bioreactors were continuously illuminated at 180 µmol photons m−2 s−1. Dashed black lines represent DCMU-added cultures (DCMU+), whereas the arrows indicate the DCMU addition time point. Green line represents non-treated culture (NT). Error bars are in SE (n = 4)

