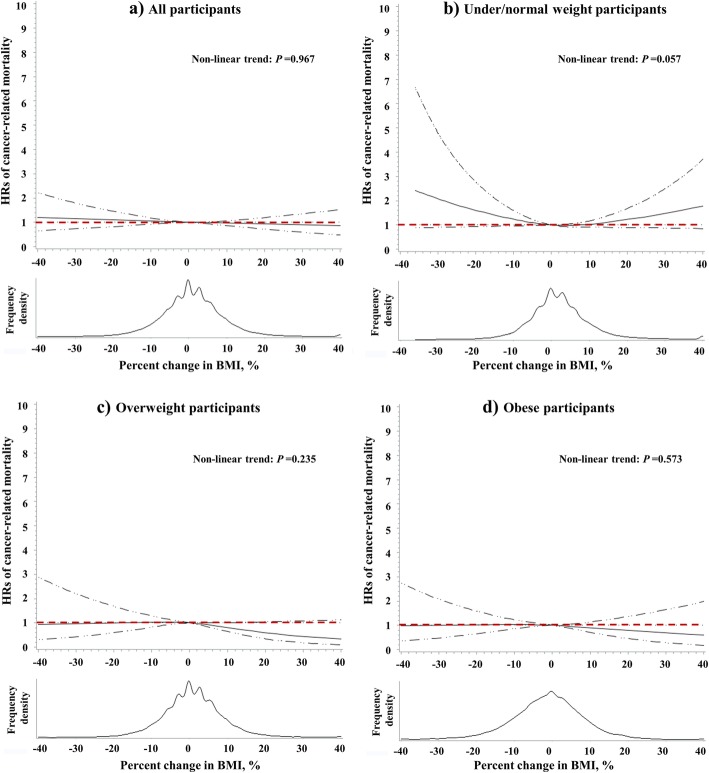
Fig. 5.
Restricted spline curves for the associations between percentage change in BMI and cancer-related mortality among overall (a), under/normal weight (b), overweight (c) and obese (d) participants. The solid curve represents the multivariate-adjusted HRs calculated by restricted cubic splines with 3 knots at the 25th, 50th, and 75th of the percentage change in BMI; the solid dashed lines represent corresponding 95% confidence interval. The reference value (HR = 1) was set at BMI percentage change = 0. HRs were estimated by cox proportional hazard model adjusted of sex, age, race, education level, family annual income, marital status, physical activity level, family history of cancer in their first-degree relatives, smoking status, screening arm, history of chronic diseases (i.e., hypertension, heart attack, stroke, emphysema, diabetes, arthritis, and osteoporosis), and BMI value at study entry (continuous)

