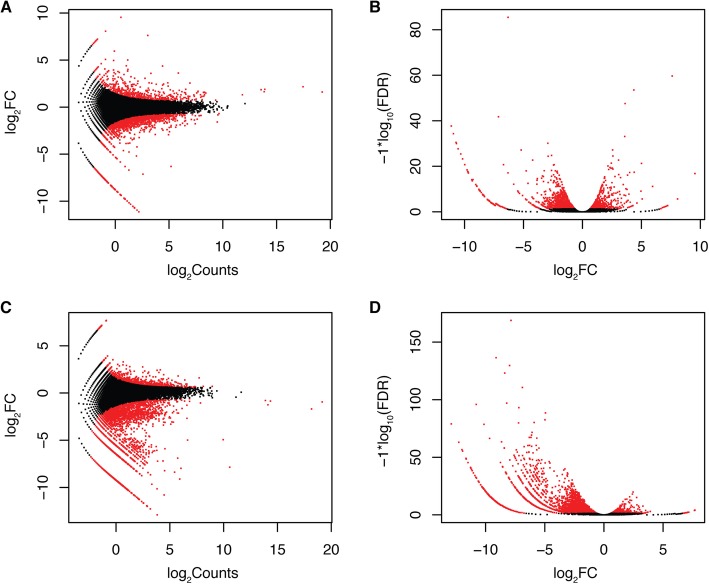
Fig. 3.
Expression profiles of waxy versus non-waxy blueberry genes based on fruit tissue expression data. a and c. MA plot (log2 fold change versus log2 counts) of all assembled genes in ‘Nocturne’ x T 300 and ‘Nocturne’ x US 1212 population; b and d. Volcano plot of log10 false discovery rate versus log2 fold change in ‘Nocturne’ x T 300 and ‘Nocturne’ x US 1212 populations. Differentially expressed genes with FDR < =0.05 are marked in red

