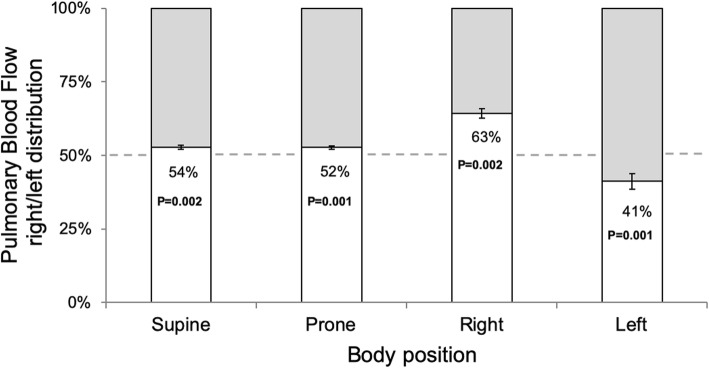
Fig. 3.
Proportion of pulmonary blood flow volume going to the right lung, shown in each tested body position. The white bars and percent numbers represent the percent distribution of flow to the right lung. The gray region represents the percent distribution to the left lung. Error bars represent standard error of the mean (SEM). P-values reflect Wilcoxon signed-rank test with even distribution as the null hypothesis

