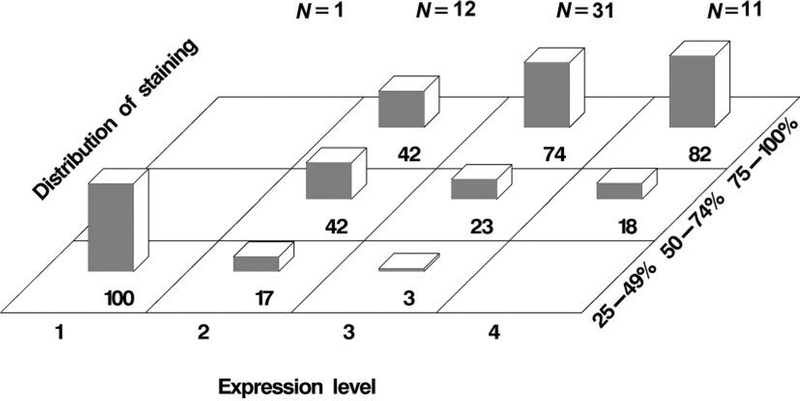
Figure 4.
Cellular distribution of podocalyxin immunohistochemical staining in high-grade tumors. The percentage of slides with tumor samples for a range of cellular distribution of staining at a given staining intensity is indicated by the number at the bottom of each bar. Staining intensity corresponds to the expression level of podocalyxin. N: Number of slides containing tumor specimens, each derived from a patient.

