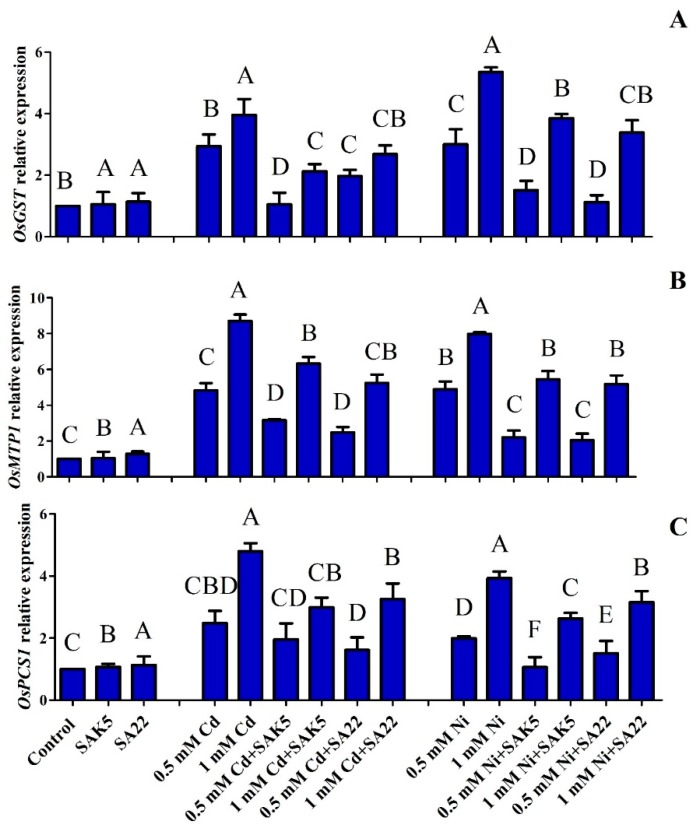
Figure 4.
(A) OsGST1 gene expression regulation following inoculation with SAK5 and SA22. (B) OsMTP1 and (C) OsPCS1 in rice plants under control conditions, cadmium stress (0.5 mM and 1 mM), and nickel stress (0.5 mM and 1 mM). Each value is the mean of three replicates. Data are means of three replicates along with standard error bars. Mean bars labeled with different letters are significantly different (p < 0.05), as evaluated by DMRT analysis.

