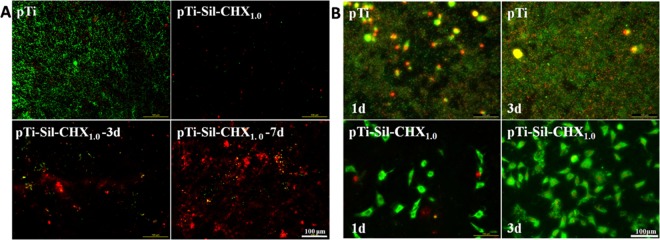
Figure 8.
(A) Fluorescence images of S. aureus on pTi and pTi-Sil-CHX1.0 surfaces before and after immersion in PBS for 3 and 7 days, visualizing live cells (green), dead cells (red), and apoptotic cells (yellow). (B) Fluorescence images of S. aureus and osteoblast cocultivation on pTi and pTi-Sil-CHX1.0 surfaces after 1 and 3 days of culture.

