. 2019 Nov 11;74:e1207. doi: 10.6061/clinics/2019/e1207

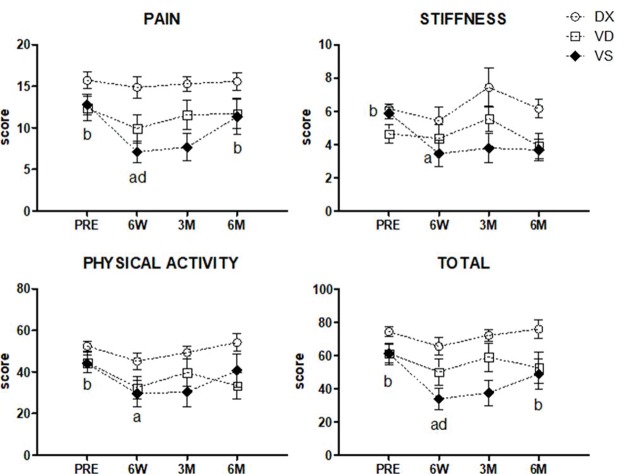
Figure 2. WOMAC score evaluation. Significant effects were observed over time in the WOMAC total score and pain, stiffness and physical activity subscores (all, p<0.05). Additionally, significant effects between groups were observed in the pain (p=0.03), stiffness (p=0.03), and physical activity (p=0.03) subscores, but not in the WOMAC total score (p=0.07). Pairwise verification demonstrated differences between DX and VS. Further separate analysis revealed significant differences only within the VS group in terms of the pain (p=0.01), stiffness (p=0.04), and physical activity (p=0.05) subscores and the WOMAC total score (p=0.03). Symbols represent mean values, dashed and straight lines represent standard deviations. 6 W: six weeks, 3 M: three months and 6 M: six months; a: compared to PRE; b: compared to 6 W; c: compared to 3 M; d: compared to 6 M.

Figure 2