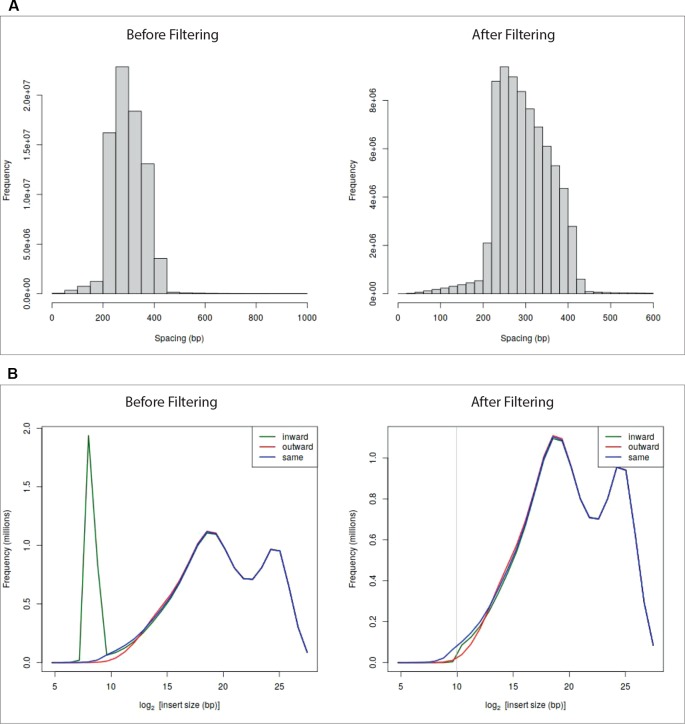
Figure 2.
Diagnostic plots and effect of the filtering on sample GSM1608509 (see A Case Study). Panel (A) shows read length distribution before and after filtering. The plot before filtering indicates that long fragments are present, the corresponding plot after filtering shows that fragments larger than 600 bp were removed. Panel (B) shows the read-orientation plot before and after filtering. The plot before filtering suggests possible dangling-end events (green line spike) located at about 28 = 256 bp, the corresponding plot after filtering shows that such inward-oriented pair of reads were removed.

