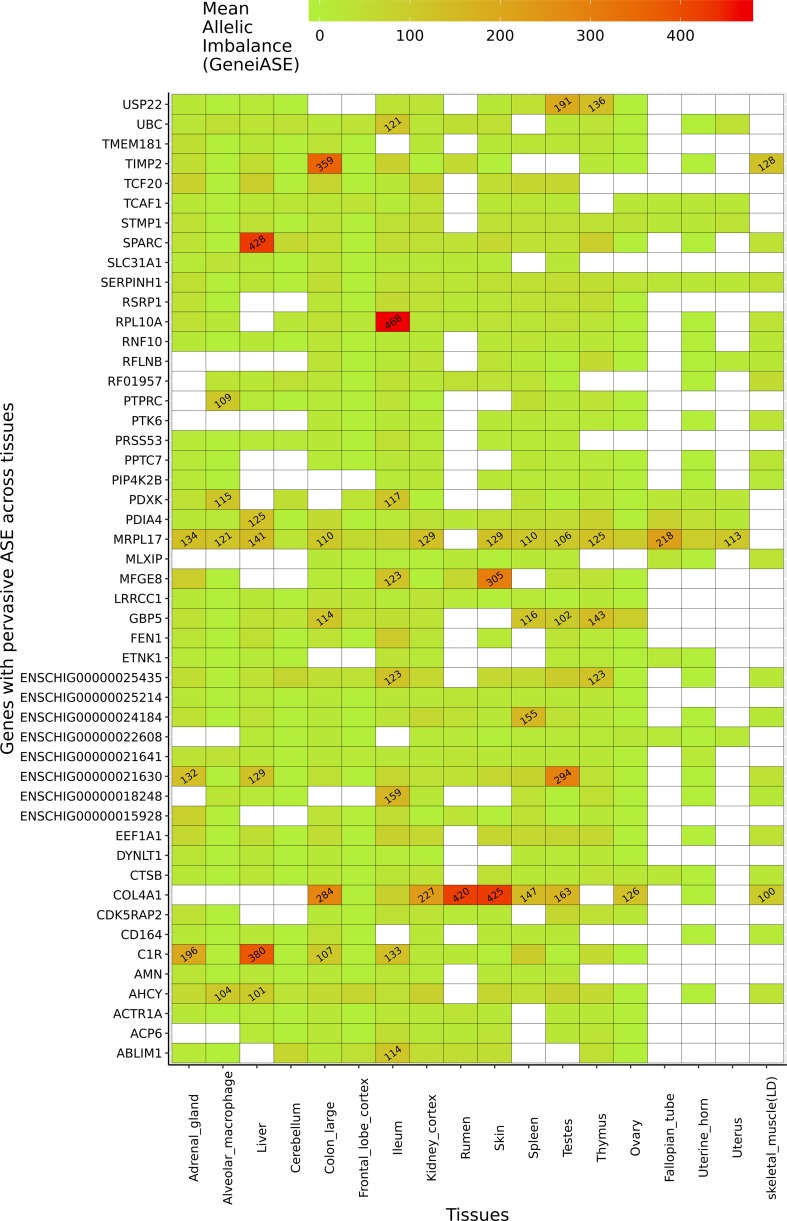
Figure 5.
Genes exhibiting the largest mean allelic imbalance (i.e., allele-specific expression averaged across all heterozygote sites within each gene) across 17 tissues and one cell type from the goat mini-atlas dataset visualised as a heatmap (red indicating the highest level of mean allelic imbalance and green the least).

