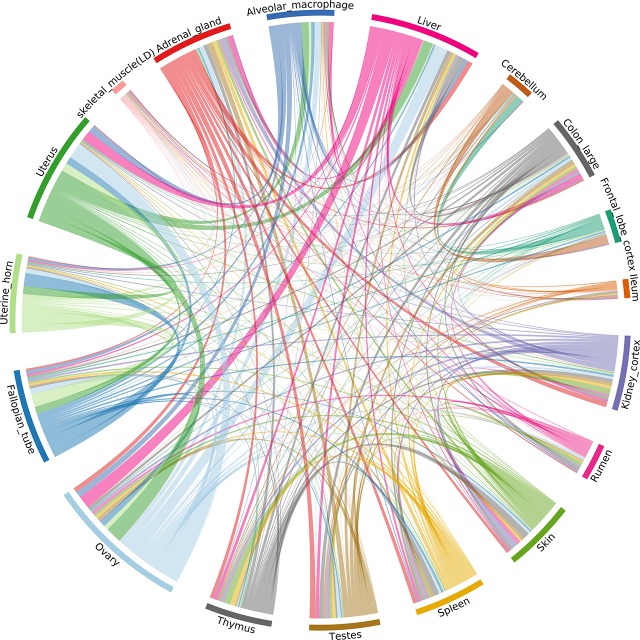
Figure 6.
Correlation of allele-specific expression (ASE) profiles shared across tissues/cell types from the goat mini-atlas dataset. Each section represents the genes showing significant allelic imbalance within the tissue. The chords represent the correlation coefficient (CC < 0.85) of ASE profiles shared between the samples (i.e., the proportion of genes showing co-imbalance).

