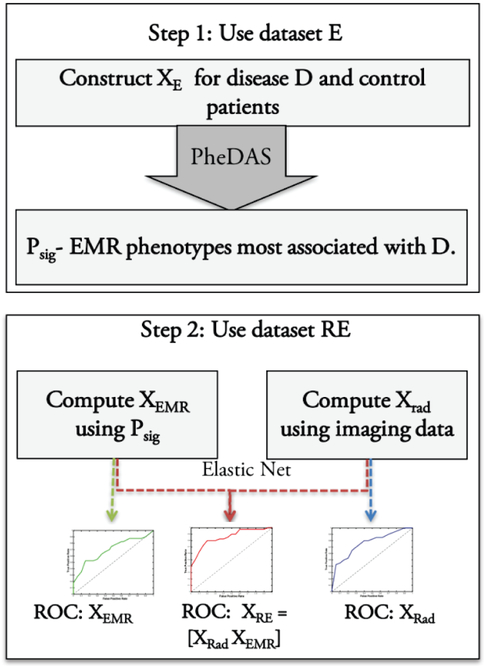
Fig. 1.
Overview for each case control experiment. In step 1, the EMR phenotypes associated with disease D, Psig are learnt from dataset E. In Step 2, EMR context signature vectors, XEMR are calculated from Psig and XRad is calculated from imaging. XRE, XRad, and XEMR are used to train an elastic net classifier and ROC curves are computed.

