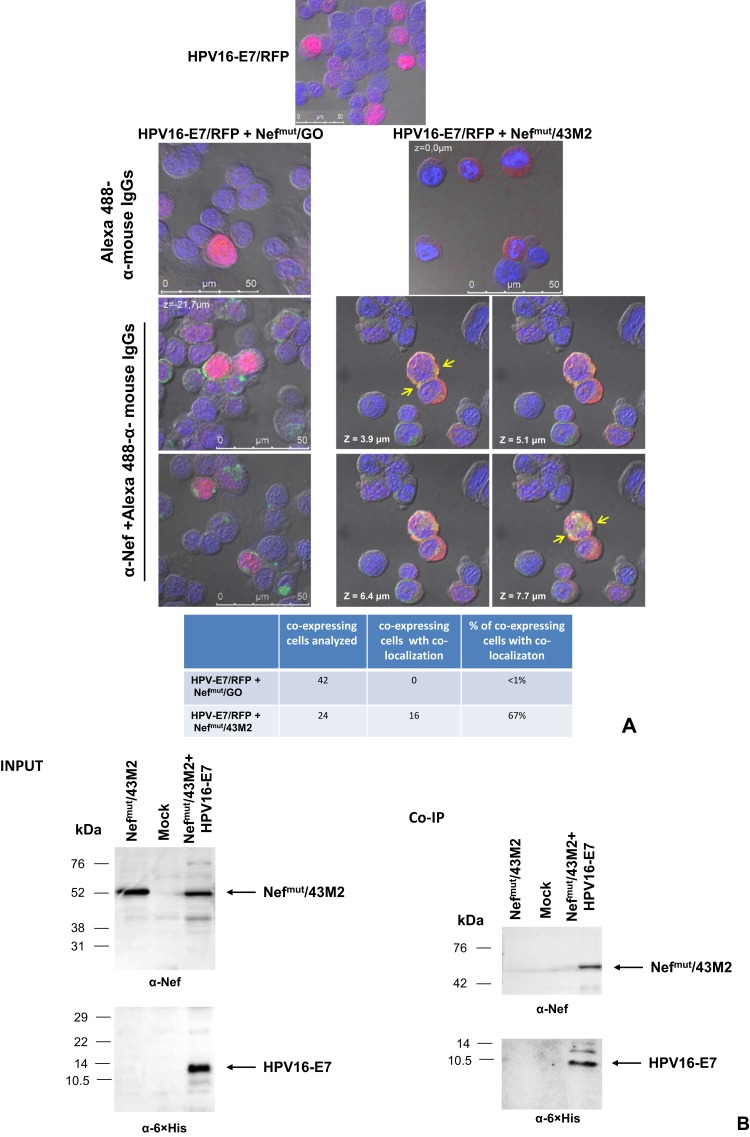
Figure 2.
Intracellular interaction between HPV16-E7 and Nefmut/43M2. (A) HPV16-E7 disposition in Nefmut/43M2 expressing cells. Confocal microscope analysis of HEK293T cells co-transfected with HPV16-E7/RFP and either Nefmut/43M2 or Nefmut/GO expressing vectors. Top panels show representative fields from cells either transfected with E7-RFP alone or co-transfected as indicated and labeled with Alexa 488-conjugated anti-mouse IgGs. Below, shown are representative fields from co-transfected cell cultures labeled first with an anti-Nef mAb, and then with Alexa 488-conjugated anti-mouse IgGs. In the case of cells co-transfected with HPV16-E7/RFP and Nefmut/43M2 expressing vectors, four Z-stack sections are shown. Here, major green to red overlapping areas are indicated by arrows. DAPI (blue fluorescence) was used to highlight cell nuclei. The images were produced by differential interference contrast. Scale bars are reported. The results are representative of two independent experiments. At the bottom, both numbers and percentages of cells showing fluorescence co-localization are reported. (B) Co-immunoprecipitation assay. 293T cells were co-transfected either with vectors expressing Nefmut/43M2 and 6×His-tagged HPV16-E7, or with Nefmut/43M2 alone. As control, mock-transfected cells were also included. Forty-eight hours later, cell extracts were incubated with an anti-6×His mAb, and then incubated with anti-mouse IgG-coupled Dynabeads. Immunocomplexes were finally revealed by anti-Nef and, as control, anti-6×His Abs. On the top, both anti-Nef and anti-6×His tag Western blot analysis on 30 μg of each cell lysate are shown. At the bottom, shown are both anti-Nef and anti-6×His tag Western blot analysis on immunocomplexes isolated from 500 μg of each cell lysate. Molecular weight markers are given in kilodaltons (kDa). The results are representative of three independent experiments.

