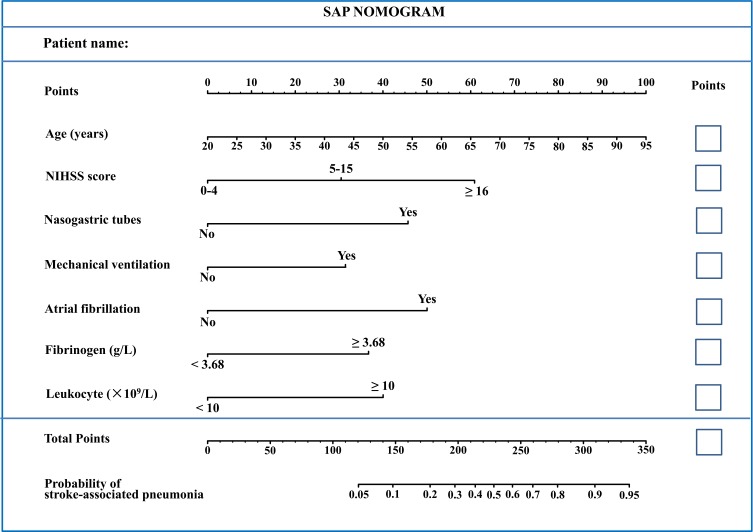
Figure 2.
Nomogram model for predicting individual risk of stroke-associated pneumonia (SAP) in AIS patients. For all patients, adding up the points identified on the points scale for all seven indicators. Then, the sum is located on the “Total Points” axis. Finally, the risk of SAP according to the nomogram is the probability of “Stroke-associated pneumonia” corresponding to “Total Points”.

