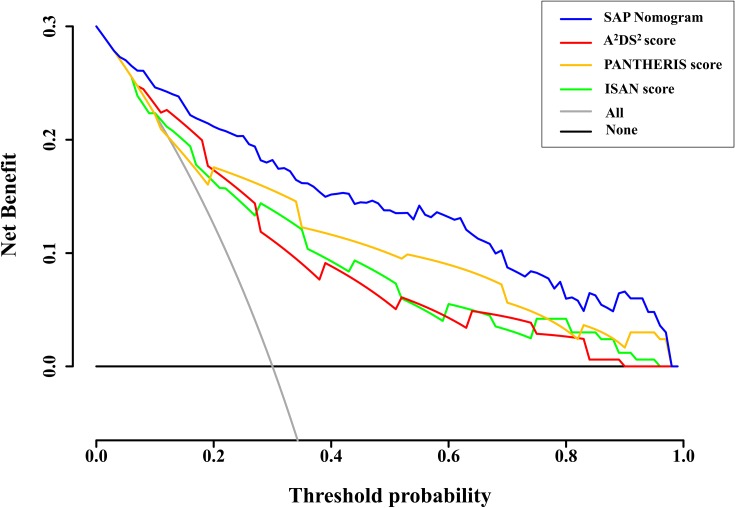
Figure 5.
Decision curves of the different scoring systems for predicting SAP. The net benefit was calculated by adding the true-positives and subtracting the false-positives. For a threshold probability >4%, application of the SAP nomogram would add net benefit compared to either the treat-all strategy or the treat-none strategy. In addition, the SAP nomogram always showed a greater net benefit than the A2DS2, ISAN, and PANTHERIS scores for predicting SAP with a threshold probability >4%.

