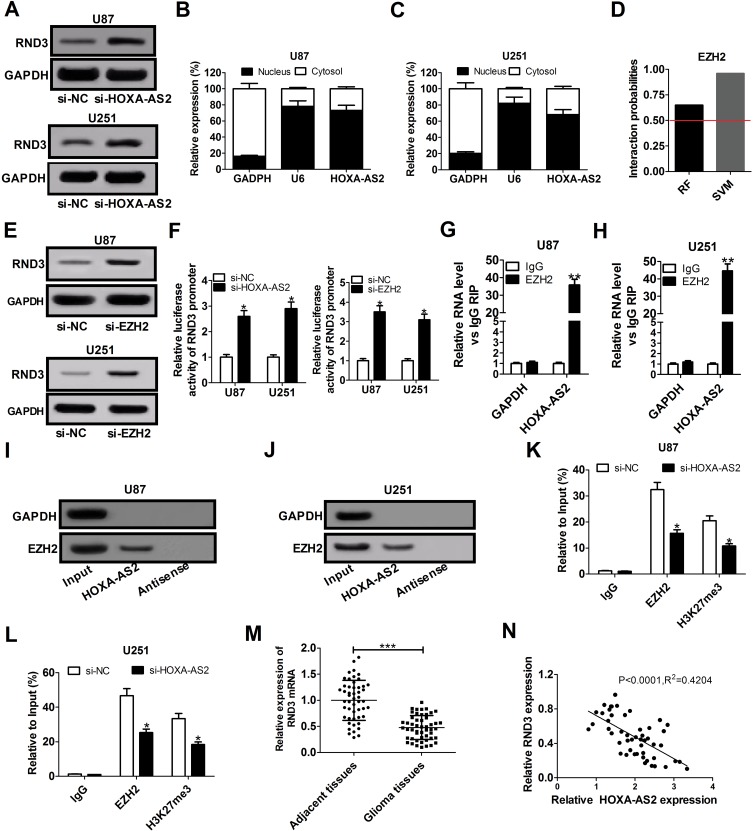
Figure 3.
HOXA-AS2 represses RND3 expression by recruiting EZH2 to its promoter region. (A) Western blot assay of RND3 protein level in U87 and U251 cells after transfection with si-NC or si-HOXA-AS2. (B and C) qRT-PCR assay was used to examine the distribution of HOXA-AS2 in cytoplasm and nucleus of U87 and U251 cells, with GAPDH as a cytoplasm marker and U6 as a nucleus marker. (D) RNA-Protein interaction prediction website (http://pridb.gdcb.iastate.edu/RPISeq/) was applied to evaluate the interaction probability between HOXA-AS2 and EZH2. Predictions with probabilities > 0.5 are regarded as positive. RPISeq predictions are based on Random Forest (RF) or Support Vector Machine (SVM). (E) Western blot assay was used to assess the effects of EZH2 knockdown on RND3 protein expression in U87 and U251 cells. (F) The influence of si-HOX1-AS2 or si-EZH2 on the luciferase activity of RND3 promoter reporter was determined in U87 and U251 cells. (G and H) RIP assays with anti-EZH2 or anti-IgG from U87 and U251 cell extracts, and then the coprecipitated RNA was subjected to qRT-PCR for HOXA-AS2. The fold enrichment of HOXA-AS2 in EZH2 RIP is relative to its matched IgG control. (I and J) The RNA pull-down assays revealed the binding between HOXA-AS2 and EZH2 in U87 and U251 cells. GAPDH is presented as the control. (K and L) ChIP of EZH2 occupancy and H3K27me3 binding in the RND3 promoter region in U87 and U251 cells transfected with si-NC or si-HOXA-AS2. IgG was used as a negative control. (M) qRT-PCR analysis of RND3 mRNA expression in tumor tissues and adjacent non-cancerous tissues from 50 glioma patients. (N) The correlation analysis of HOXA-AS2 and RND3 expression in glioma tissues. Data are shown as mean ± SD of 3 independent experiments. *P < 0.05, **P < 0.01, ***P < 0.001.

