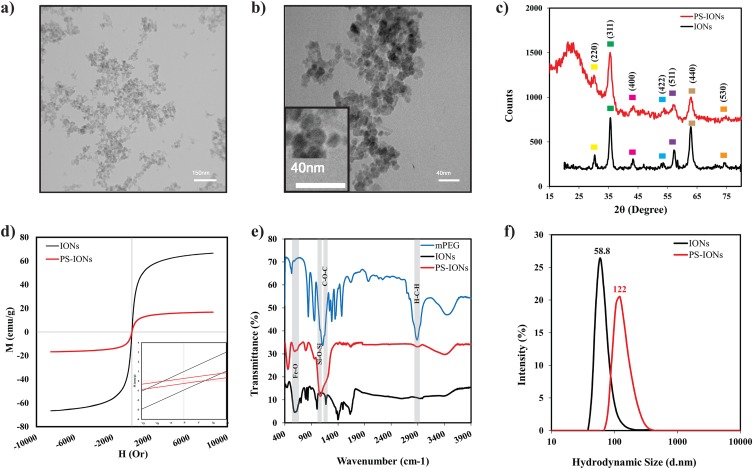
Figure 1.
(a, b) TEM images of PS-IONs (scale bars are 150 nm and 40 nm, respectively). (c) XRD patterns [the yellow, green, pink, blue, violet, light brown and orange squares relate to (220), (311), (400), (422), (511), (440) and (530) planes of the spinel structure of magnetite, respectively], (d) hysteresis loops, (e) FT-IR spectra, and (f) DLS particles size distribution profiles of IONs (black line) and PS-IONs (red line).

