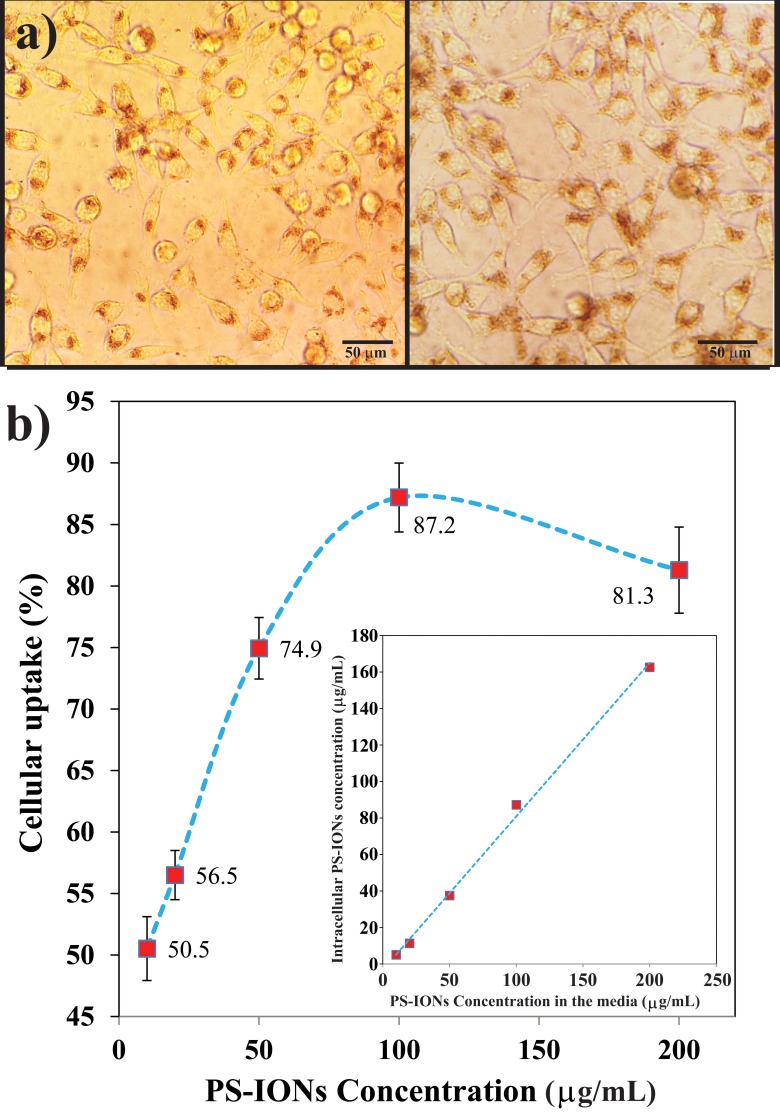
Figure 3.
(a) Light microscopy images of the cells (the total magnification was 400 times) exposed to 100 (left) and 200 µg/mL (right) of PS-IONs for 24 hrs. The brown dots show the uptaken nanoparticles. (b) Concentration dependent cellular uptake percentage. The inset shows the amount of PS-IONs uptake (µg/mL) versus initial PS-IONs concentration (µg/mL) in the culture media.

