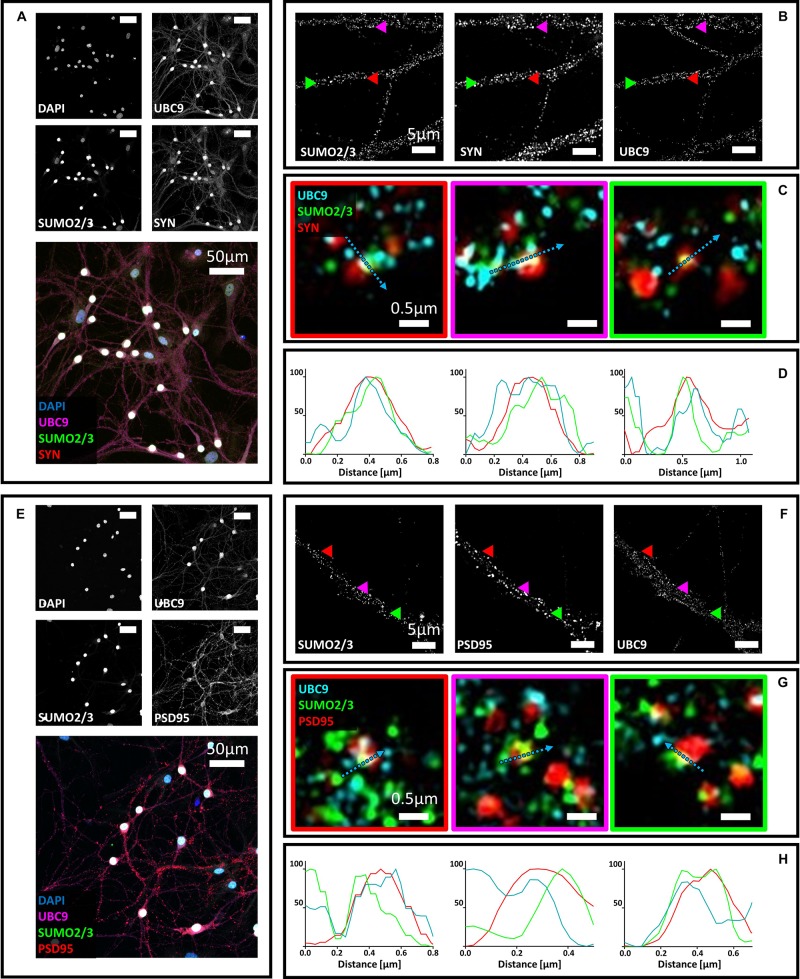
FIGURE 4.
(A) Confocal microscopy of primary neurons. Cells were immunostained for SUMO2/3 (custom antibody, green), synaptophysin (red) and Ubc9 (Abcam #ab21193, magenta). DAPI was used to stain the nuclei. Scale bar, 50 μm. Images were obtained using a 40× objective and displayed as z projection. (B) SIM microscopy. Colored arrowheads indicate the position of the inset shown in panel (C). (C) Merge images represent single stack of SUMO2/3 (green), synaptophysin (red) and Ubc9 (cyan). Scale bar, 0.5 μm. (D) Intensity profile normalized for each channel to 100 (arbitrary unit) using the same color code of SIM merge images and representing the values indicated by the cyan arrow. (E) Confocal microscopy of primary neurons. Cells were immunostained for SUMO2/3 (custom antibody, green), PSD95 (red) and Ubc9 (Abcam #ab21193, magenta). DAPI was used to stain the cell nuclei. Scale bar, 50 μm. Images were obtained using a 40× objective and displayed as z projection. (F) SIM microscopy, colored arrows indicate the position of the inset shown in panel (G). (G) Merge images represent single stack of SUMO2/3 (green), PSD95 (red), and Ubc9 (cyan). Scale bar, 0.5 μm. (H) Intensity profile normalized for each channel to 100 (arbitrary unit) using the same color code of SIM merge images and representing the values indicated by the cyan arrow.

