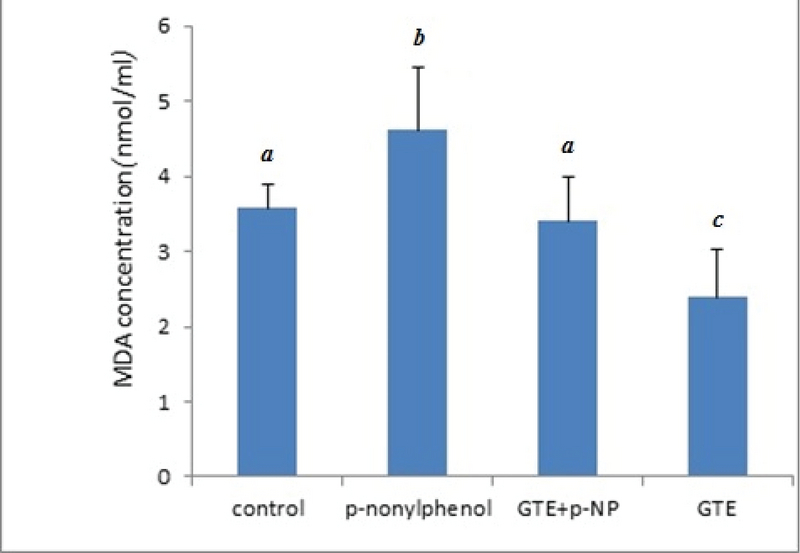
Figure 3.

Comparing the MDA concentration (nm/ml) in different groups of rats, 56 days after treatment with p-NP and GTE. Values are means SD. Means with different code letter in a column are significantly different (one-way ANOVA and Tukey's test, p 0.05).
