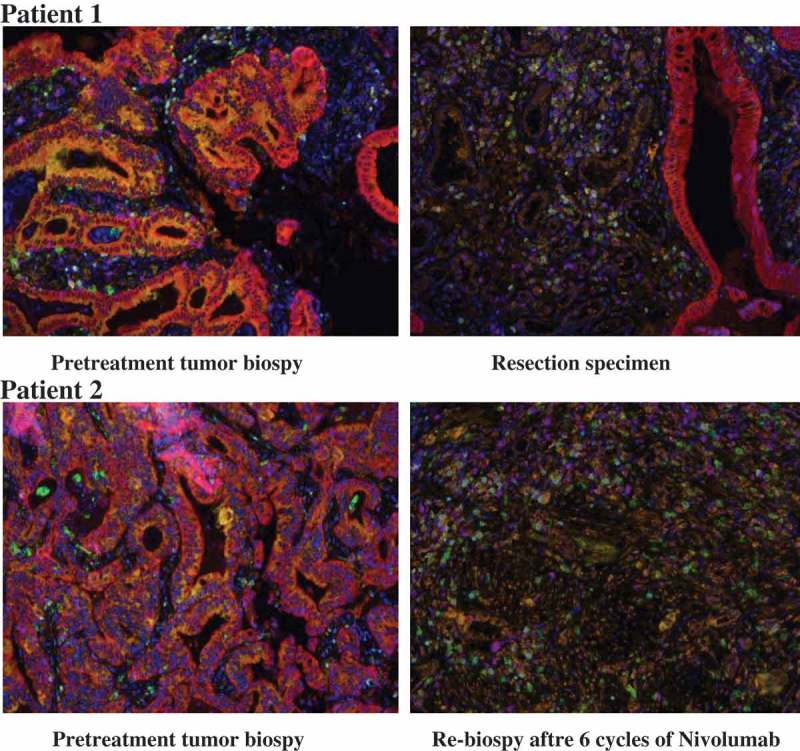
Figure 2.

Pathological assessment of response to neoadjuvant blockade of PD-1.
Multiplex immunofluorescence staining was performed on specimens obtained from patient 1 (upper row) and patient 2 (lower row) before (left) and after (right) neoadjuvant administration of nivolumab. With this staining technique, visible structures include cytokeratin (CK) positive tumor cells (magenta), DAPI positive cells (dark blue), CD68+ macrophages (green), FoxP3+ regulatory T cells (light-blue), CD8 + T cells (purple), PD-1 + cells (yellow-green), and PD-L1 + cells (orange). In the pretreatment specimen, PD-L1 positive and CD68+ macrophages abutting PD-1 positive, CD8 + T cells. There are multiple foci where PD-L1 and PD-1 are expressed in close proximity to each other. After administration of nivolumab, CD8+ and PD-1+ immune cells infiltration was observed. PD-L1 expression was observed on macrophages and other infiltrating immune cells.
