
Figure 10.
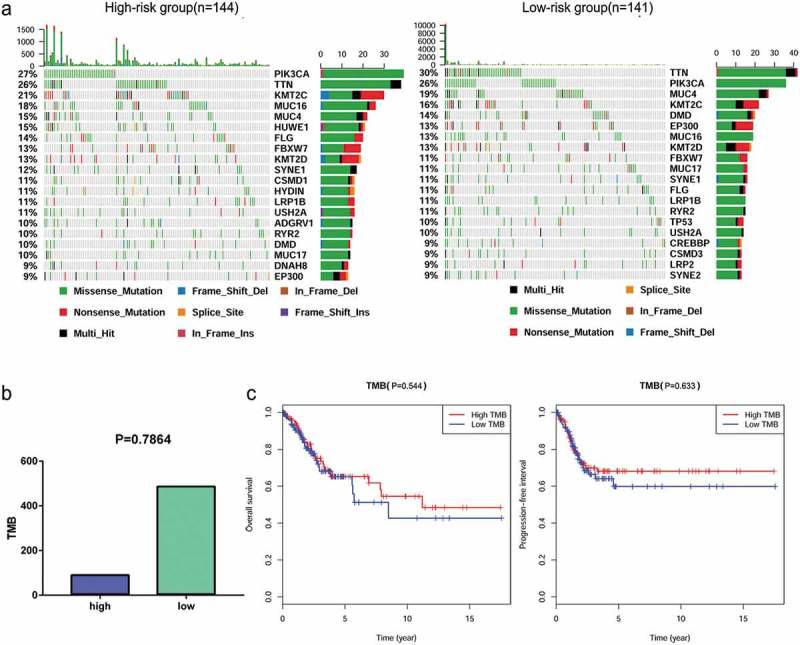
The mutation profile and TMB among low-risk and high-risk groups. (a) Mutation profile of low-risk and high-risk groups. (b) The relationship between the immune related risk signature and TMB.(c) The association of TMB and OS and PFI in TCGA cervical cancer dataset.