Figure 7.

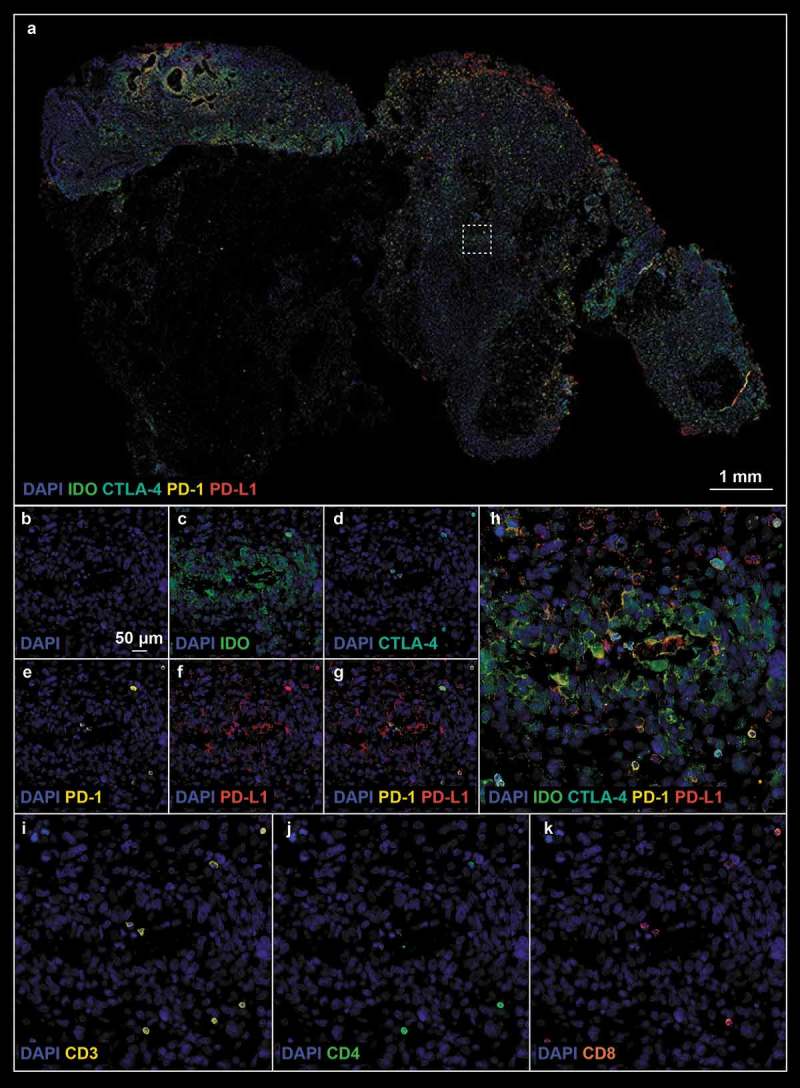
(a). Post- treatment tissue biopsy stained with checkpoint protein (Panel 2) antibodies; white boxes define the region of interest. (b–k). Refer to Figure 6 legend for biomarker definition.

(a). Post- treatment tissue biopsy stained with checkpoint protein (Panel 2) antibodies; white boxes define the region of interest. (b–k). Refer to Figure 6 legend for biomarker definition.