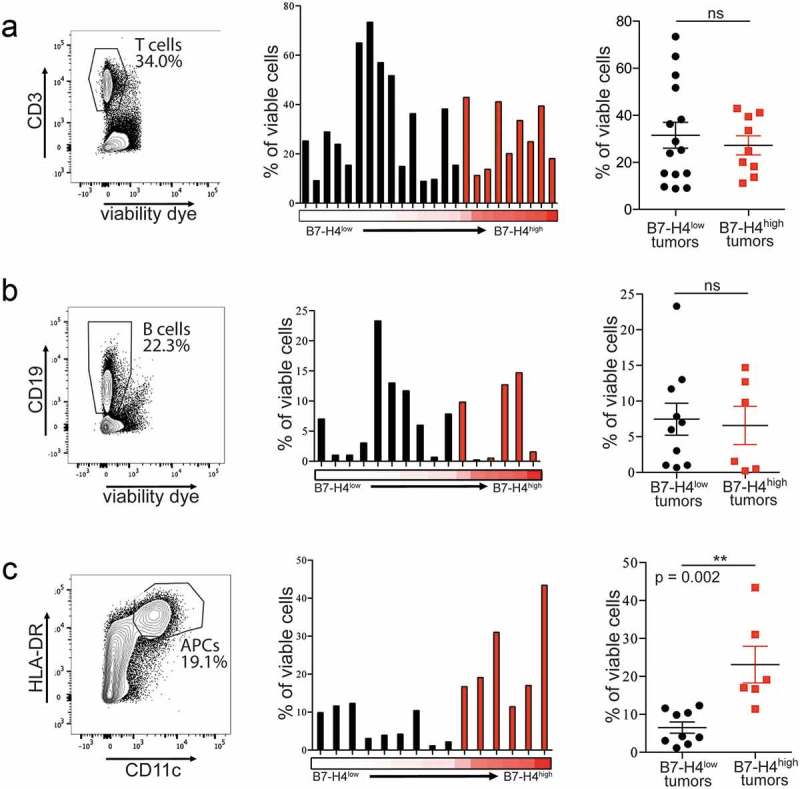
Figure 2.

Tumors with surface expression of B7-H4 have comparable frequencies of infiltrating T and B cells, and higher frequencies of infiltrating APCs. T cell (a; n = 24), B cell (b; n = 16), and APC (c; n = 15) frequencies as percentage of viable cells from tumors expressing low (black) or high (red) levels of B7-H4 on the tumor cell surface. Spike plots represent the frequency of immune cells isolated from individual tumors with the proportion of tumor cells expressing B7-H4 represented by red heatmap below (low = 0%, high = 67%). Column plots show data from tumors expressing low (black) and high (red) levels of B7-H4 with mean ± SEM.
