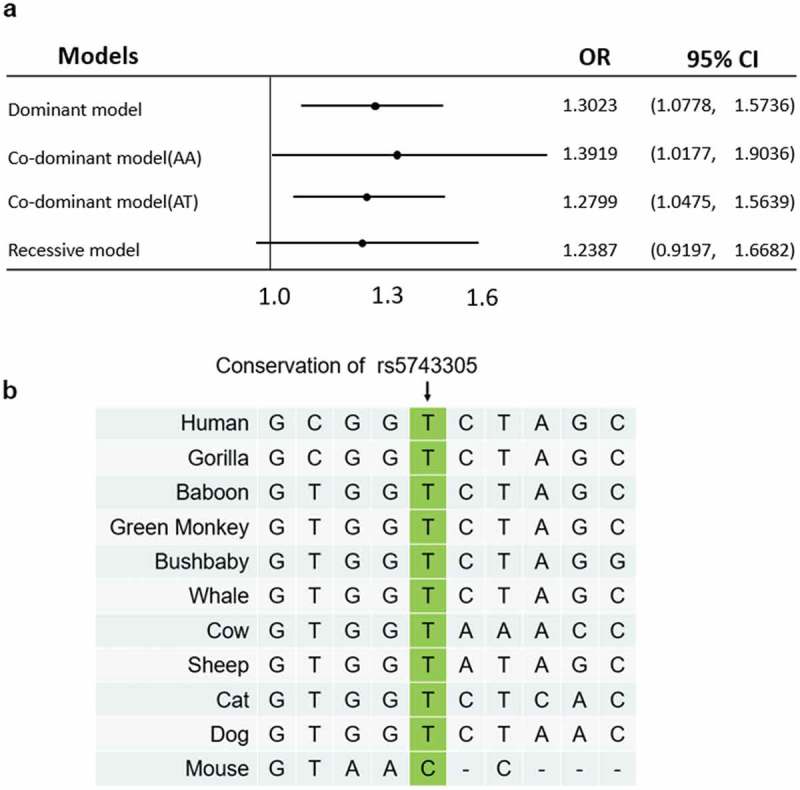
Figure 1.

Odds ratio plot and homology study of rs5743305. (A) The odds ratio plot shows the allelic effects of rs5743305 in different models. Dominant model: TT vs. AT+AA; codominant model: AA vs. TT, and AT vs. TT; recessive model (TT vs. AT+AA). The error bars represent the 95% confidence intervals of the odds ratios.OR = odds ratio. (B) The homology study showed that the rs5743305 position of the TLR3 gene is relatively conserved in most animals. Most animals have a T at this position, whereas mouse has a C at this position.
