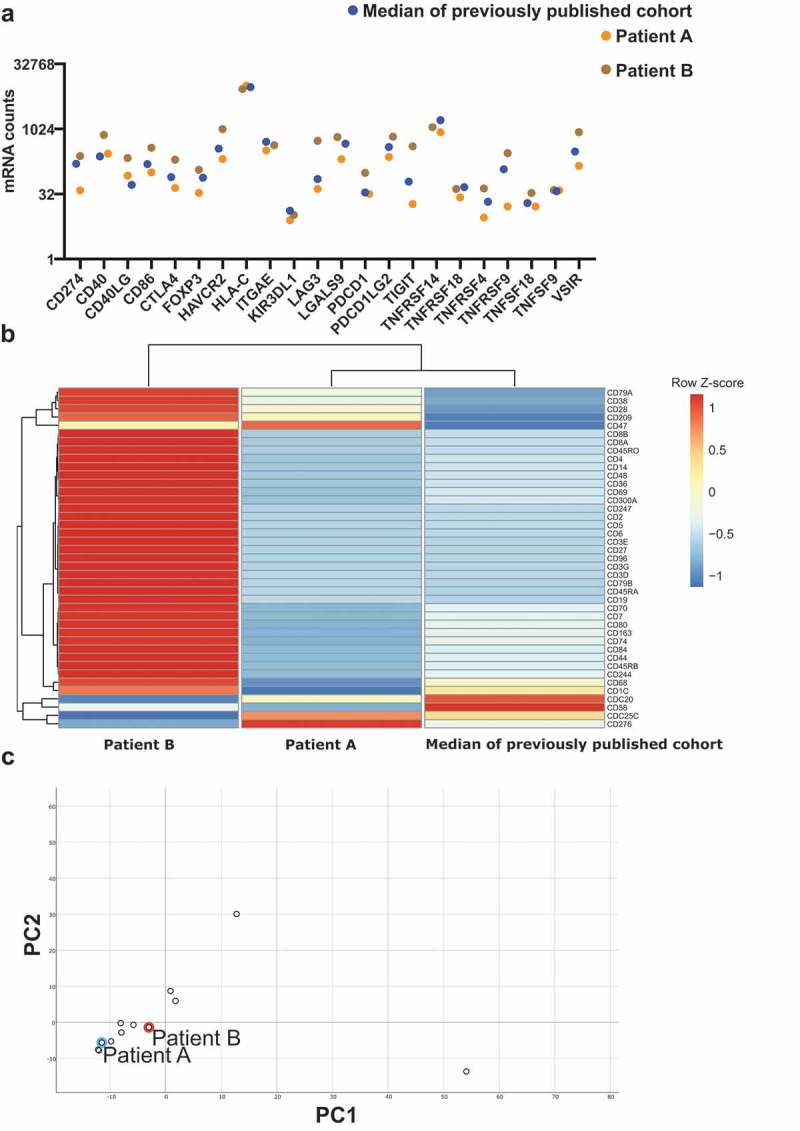
Figure 2.

Immune profile of two patients with advanced PDS treated with CPI.
(a) RNA expression of various immune checkpoint molecules and ligands. Cases are color-coded: Patient A (orange), patient B (brown), median (blue). Median signifies the median value from our previously published study (N = 9). (b) Heatmap of all CD molecules included in the Nanostring IO360 panel. Columns represent patients and rows represent genes. Median signifies the median value from our previously published study (N = 9).4 Expression levels have been centered and scaled using z-scores within rows. Rows and columns have been grouped using an unsupervised clustering approach. (c) Principal component analysis of all genes from the IO360 Nanostring panel. Patient A and patient B are both highlighted.
