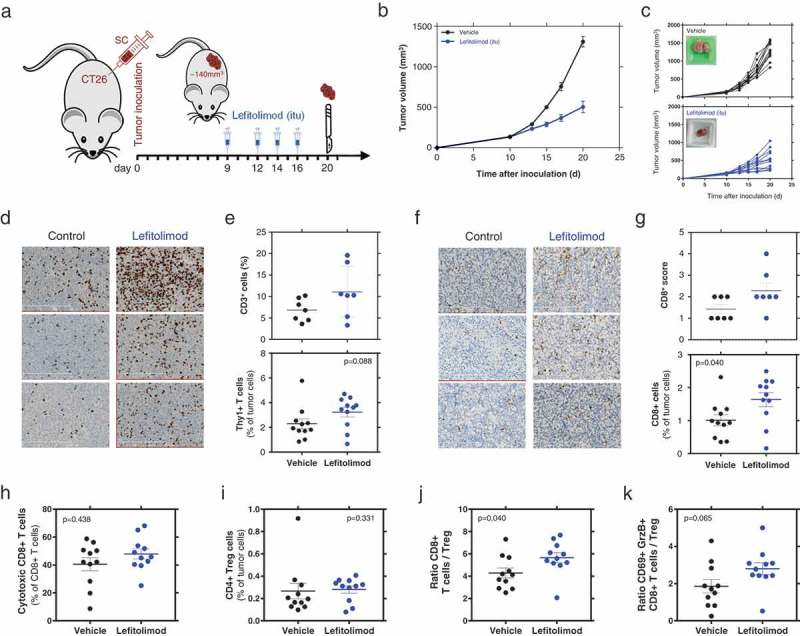
Figure 1.

Beneficial modulation of the TME by lefitolimod in vivo. (a), Balb/c mice (N = 14) were inoculated sc with 5 × 10⁴ CT26 tumor cells in 50% matrigel. Established tumors (app. 140 mm3) were injected with 200/250 µg lefitolimod (itu) or vehicle (control) at day 10, 13, 15 and 17. Mice were sacrificed at day 20 for tumor preparation. Tumor tissue was embedded to perform FFPE sections or frozen sections or used to prepare single-cell suspensions which are analyzed by flow cytometry. (b), mean tumor growth (± SEM), p ≤ 0.0001 at days 15, 17, 21 (Sidak`s multiple comparison test). (c), tumor growth from individual mice (top: vehicle, bottom: lefitolimod) – inlay: example of tumor at sacrifice. (d), examples from three representative mice each treated with vehicle or lefitolimod of CD3+ IHC staining (FFPE sections), length of scale bar 300 µm. (e), determination of CD3+ cells in the tumor using the Tissue studioTM software (Definiens®) (p = .097, N = 7, top) or flow cytometry (p = .088, N = 11, bottom). (f), examples from three representative mice each treated with vehicle or lefitolimod of CD8+ IHC staining (frozen sections), length of scale bar 300 µm. (g), determination of CD8+ cells in the tumor via IHC scoring (p = .122, N = 7, top) or flow cytometry (*p = .04, N = 11, bottom). (h-k), Flow cytometric assessment of T cell subpopulations: activated cytotoxic CD8+ T cells (CD8+CD69+GranzymeB+) (p = .438), (h), CD4+ regulatory T cells (p = .331), (i), ratio CD8+ T cells/CD4+ regulatory cells (*p = .04), (j), ratio cytotoxic T cell/CD4+ regulatory T cells (p = .065)(k), Mann–Whitney test was used.
